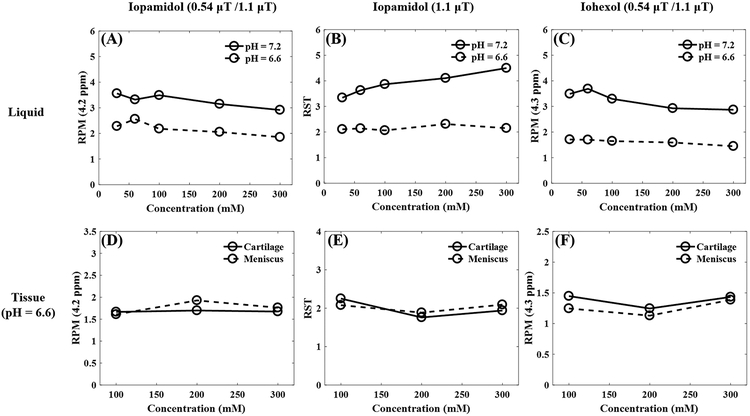
Figure 3.
Investigation of CEST effects versus contrast agent concentrations for both liquid and tissue phantoms at 35°C. The first row shows the RPM values at 4.2 ppm for iopamidol (A), RST values at 1.1 μT for iopamidol (B), and RPM values at 4.3 ppm for iohexol (C) of the liquid phantom with two pH values of 6.6 and 7.2. The concentrations of both iopamidol and iohexol liquid phantom range from 30 to 300 mM. The second row shows the RPM values at 4.2 ppm for iopamidol (D), RST values at 1.1 μT for iopamidol (E) and RPM values at 4.3 ppm for iohexol (F) of the tissue phantom including both cartilage and meniscus at pH 6.6. The concentrations of both the iopamidol and iohexol tissue phantoms range from 100 to 300 mM. RPM = ratio of RF power mismatch, RST = relative saturation transfer, ppm = parts per million, mM = millimolar.

