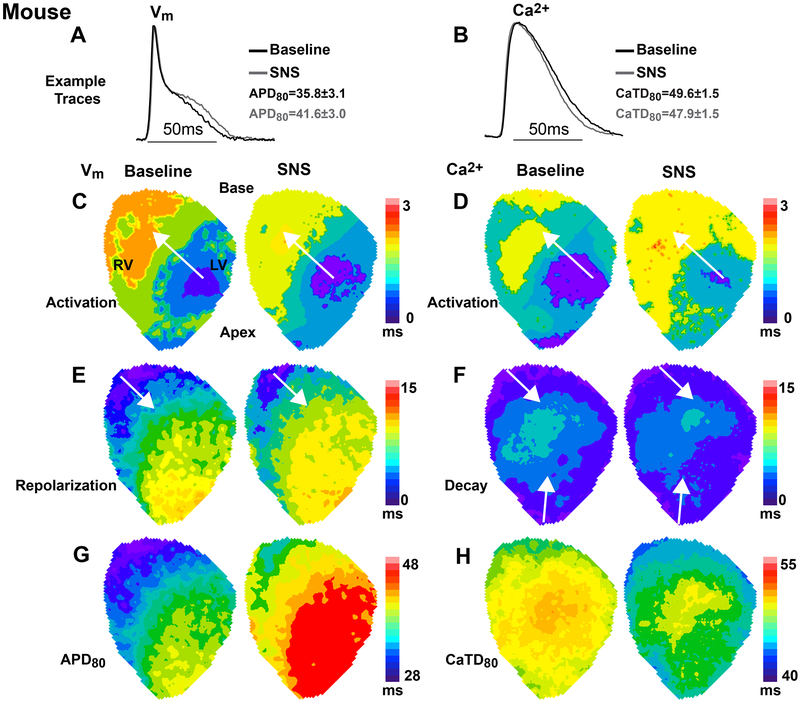
Figure 6.
Spatio-temporal responses to 20 sec of sympathetic nerve stimulation (SNS) in the mouse heart during constant atrial pacing at a cycle length of 100ms. (A-B) Example optical action potentials (APs) and normalized Ca2+ transients (CaTs) at baseline (black) and with SNS (grey). Data indicate average change in AP duration (APD) and CaT duration (CaTD) for the heart shown in this figure. (C-D) Example maps of AP and CaT activation at baseline and with SNS, which were spatially in-phase and changed little with SNS. (E-F) Example maps of repolarization and CaT decay at baseline and with SNS showing little change in the direction of repolarization or CaT decay. (G-H) Example maps of APD and CaTD showing APD prolongation and CaTD shortening.

