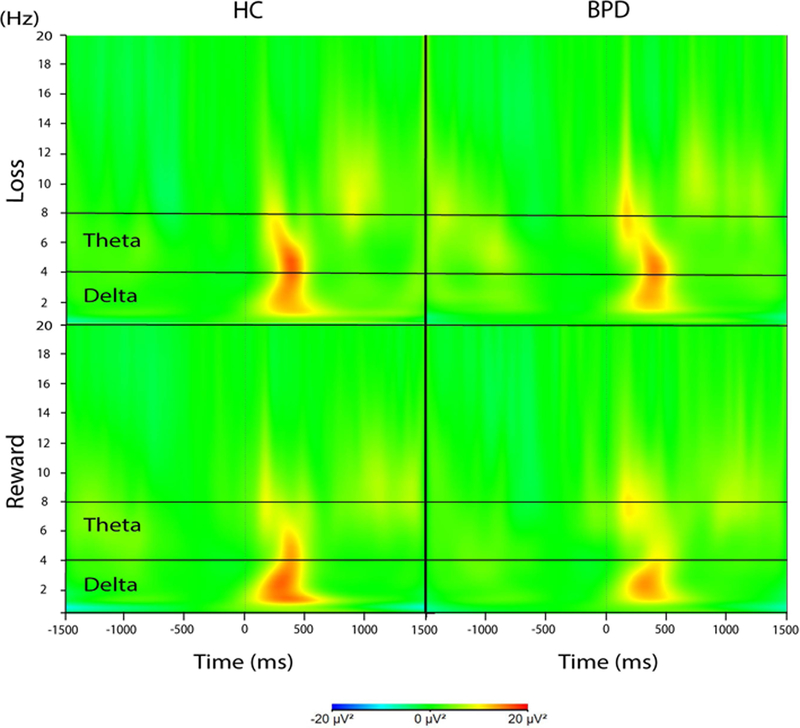
Figure 2.
Time-frequency plots for losses (top panel) and rewards (bottom panel) for healthy controls (HC; n = 35, left panels) and female adolescents and young adults with borderline personality disorder (BPD; n = 33, right panels). Theta activity was recorded at FCz and delta activity was recorded at Cz.

