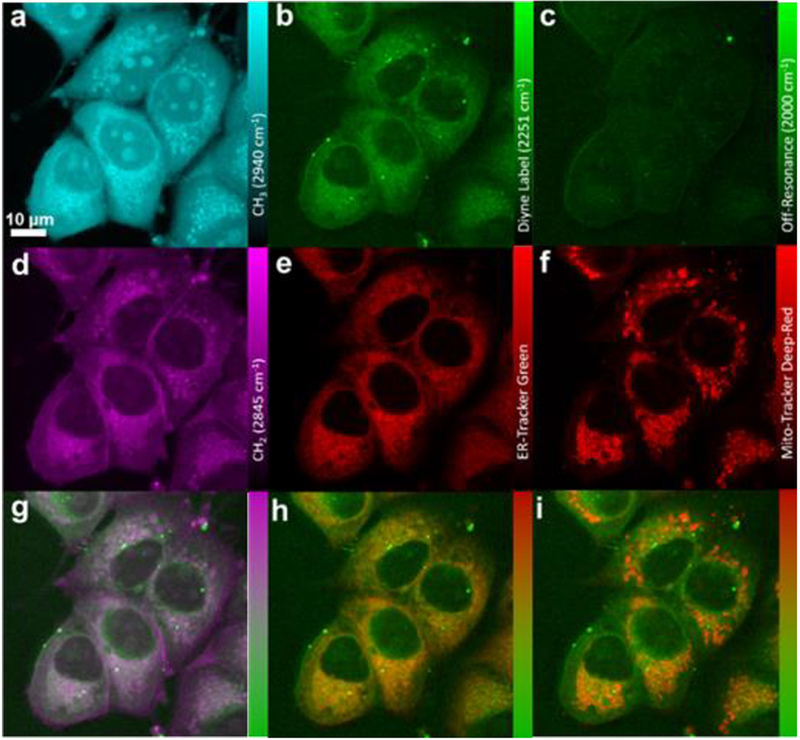
Figure 3.
SRS and fluorescence imaging of PhDY-NeoA (4) in MCF-7 cells. a) CH3 channel at 2940 cm−1 representing proteins. b) Diyne label at 2251 cm−1. c) Off-resonance channel at 2000 cm−1. d) CH2 channel at 2845 cm−1, representing lipids. e) Confocal fluorescence imaging of ER-Tracker excited at 488 nm. f) Confocal fluorescence imaging of Mito-Tracker excited at 635 nm. g) Overlay image of d) lipids and b) diyne label. h) Overlay image of e) ER-Tracker and b) diyne label. i) Overlay image of f) Mito-Tracker and b) diyne label.

