Fig. 2.

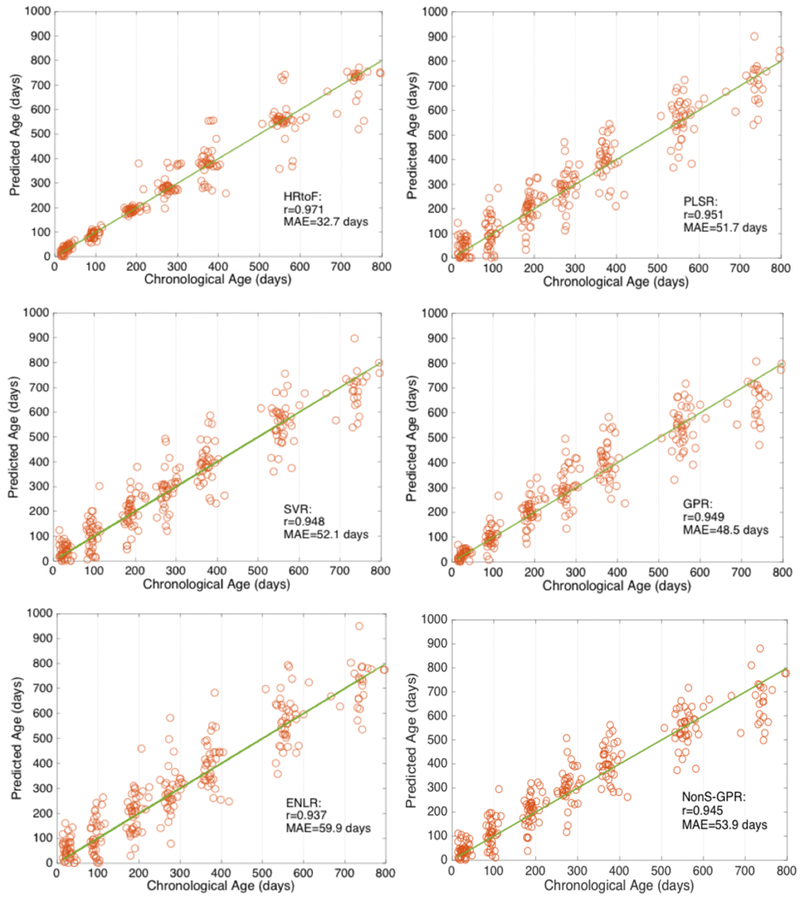
Scatter plots of the chronological age and predicted age obtained by HRtoF, PLSR, SVR, GPR, ENLR, and NonS-GPR are shown in the 6 subfigures, respectively. The solid line describes the best predictions.

Scatter plots of the chronological age and predicted age obtained by HRtoF, PLSR, SVR, GPR, ENLR, and NonS-GPR are shown in the 6 subfigures, respectively. The solid line describes the best predictions.