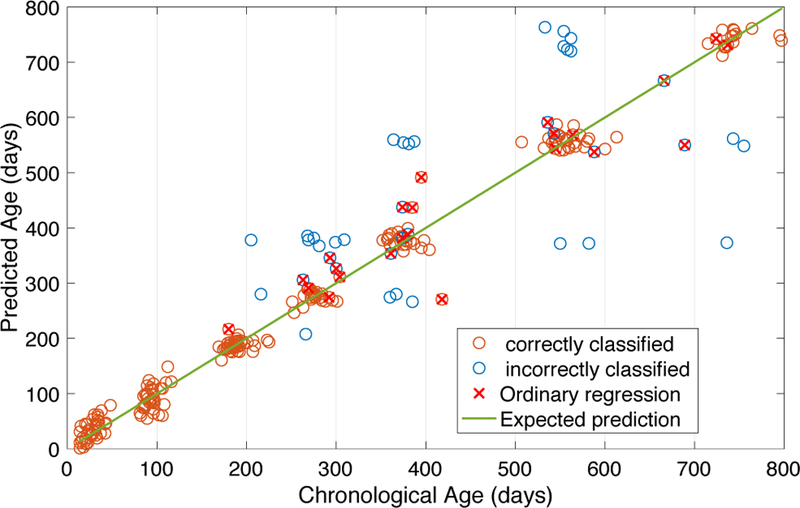
Fig. 7.

The detailed information in the scatter plot of the chronological ages and predicted ages obtained by HRtoF. The circles with red crosses represent the prediction ages obtained by the ordinary prediction (Belief≤ θ). The circles without red crosses on it represent the prediction ages obtained by the two-stage prediction (Belief> θ). Red circles represent the corresponding scans, which were correctly classified by the rough prediction stage, while blue circles represent the corresponding scans that were incorrectly classified by the rough prediction stage.
