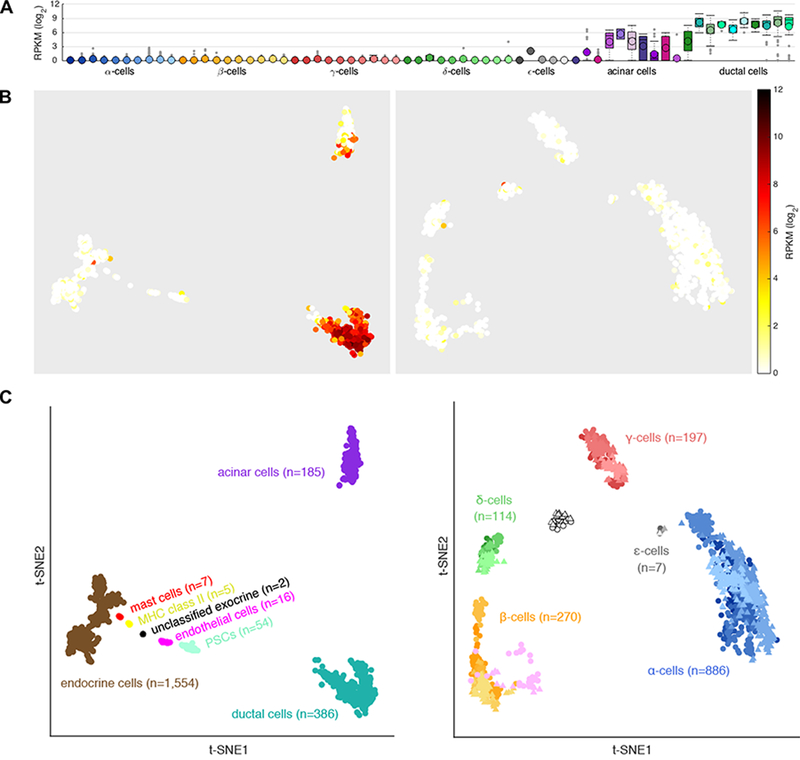
Figure 2.
CFTR expression in isolated human islet cells. Data captured from [(Segerstolpe, et al. 2016) as visualized at http://sandberg.cmb.ki.se/pancreas/]. (A) Single cell RNAseq results for CFTR expression in isolated islets collected from 10 individuals. Boxplots summarize CFTR expression in Reads Per Kilobase of transcript per Million reads (RPKM) on a log2 scale across the 7 major cell types for each donor. The first 6 boxes for each cell-type correspond to healthy individuals and the last 4 to individuals with type 2 diabetes. (B) t-SNE plot of cells grouped by transcriptome similarity and colored according to CFTR expression according to the indicated log2 RPKM scale. (C) Legend indicating cell types. (B, C) Left panels show all cell types (n=2,209) and right panels show endocrine cell types only (n=1,554).

