Figure 2.

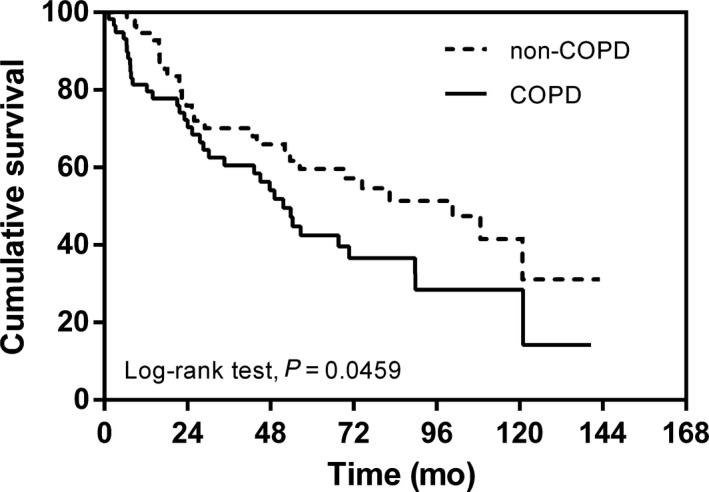
Kaplan–Meier curve of overall survival showing presence versus absence of chronic obstructive pulmonary disease after propensity score matching 105 × 73 mm (600 × 600 DPI)

Kaplan–Meier curve of overall survival showing presence versus absence of chronic obstructive pulmonary disease after propensity score matching 105 × 73 mm (600 × 600 DPI)