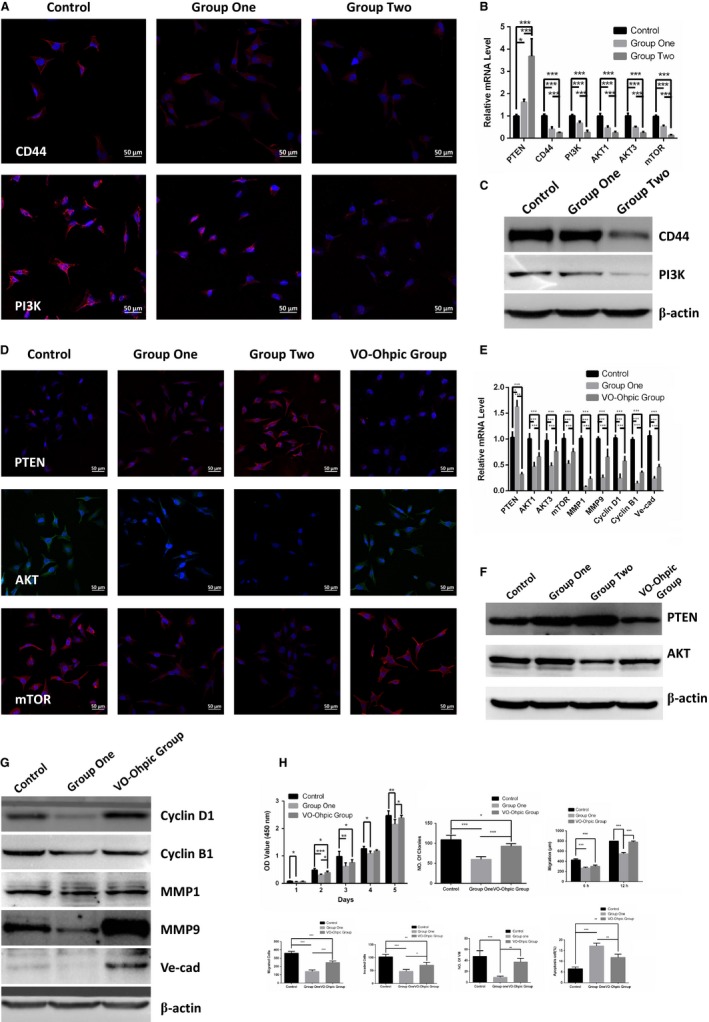
Figure 5.

ESC microenvironment reduced the malignancy of A2058 by down‐regulating PI3K/AKT pathway. A, Representative immunofluorescence staining of CD44 and PI3K of A2058 in control, group one and group two were detected by laser scanning confocal microscope. B, The comparison of mRNA expression of PTEN, CD44, PI3K, AKT1, AKT3 and mTOR on in control, group one and group two. Data are normalized to GAPDH. C, WB analysis expressing CD44 and AKT in control, group one and group two. β‐actin was used as a loading control. D, Representative immunofluorescence staining of PTEN, AKT and mTOR in control, group one, group two and VO‐Ohpic Group. E, The comparison of mRNA expression of PTEN, AKT1, AKT3, mTOR, MMP1, MMP9, Cyclin D1, Cyclin B1, Ve‐cad in control, group one and VO‐Ohpic Group. F, The expression of PTEN and AKT were examined by WB in control, group one, group two and VO‐Ohpic Group. G, WB analysis expressing Cyclin D1, Cyclin B1, MMP1, MMP9 and Ve‐cad on A2058 in control, group one and VO‐Ohpic Group. Data presented as mean ± SD. H, Quantification and comparison of cell proliferation, migration, invasion and VM tube formation on A2058 in control, group one and VO‐Ohpic Group. *P < 0.05, **P < 0.01 ***P < 0.001. ESC, embryonic stem cell. Ve‐cad, vascular endothelial‐cadherin
