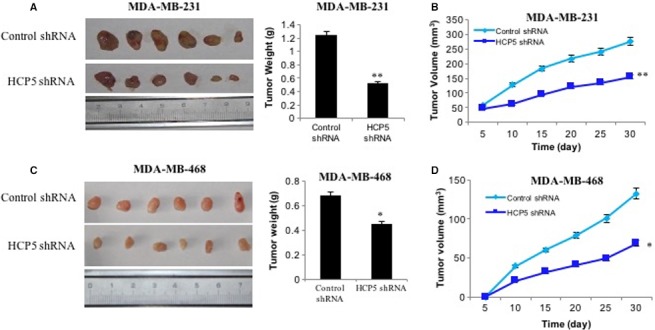
Figure 3.

Knockdown of HCP5 inhibited breast cancer cells growth in vivo. A, Representation picture and tumor weight of tumor formation of xenograft in nude mice in lv10‐sh‐control and lv10‐sh‐HCP5 MDA‐MB‐231 cells (each group n = 6). B, Summary of tumor volume of mice which were measured in every 5 days in lv10‐sh‐control and lv10‐sh‐HCP5 MDA‐MB‐231 cells. C, Representation picture and tumor weight of tumor formation of xenograft in nude mice in lv10‐sh‐control and lv10‐sh‐HCP5 MDA‐MB‐468 cells (each group n = 6). D, Summary of tumor volume of mice which were measured in every 5 days in lv10‐sh‐control and lv10‐sh‐HCP5 MDA‐MB‐468 cells. ** P < 0.01
