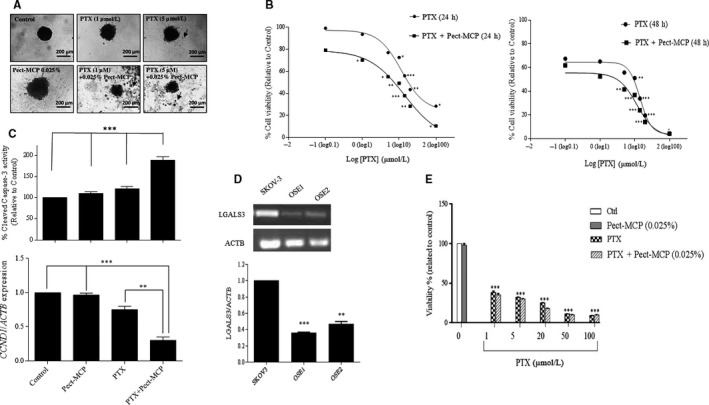
Figure 3.

Pect‐MCP synergizes with paclitaxel to kill SKOV3 MCTS but not normal primary human ovarian surface epithelial cells. A, Photograph of SKOV‐3 MCTS treated with PTX or Pect‐MCP alone or in combination for 48 h compared to control (untreated). Floating cells represent dead cells (arrows). Photos are representative of one of the three performed experiments. B, Cells were treated, with different concentrations of PTX ranging from 0.1 µM to 100 µM alone or in combination with Pect‐MCP (0.025%) for 24 h and 48 h, respectively. Cytotoxicity was assessed by MTT assay. The synergistic effect of PTX and Pect‐MCP combination was analyzed by nonlinear regression using GraphPad Prism software (n = 4). Data are presented as mean ± SD, n = 3. C, SKOV‐3 MCTS were treated with PTX (5 µM) or Pect‐MCP (0.025%) alone or in combination and Caspase‐3 activity was measured using colorimetric protease assay as indicated (upper panel). Scale bar: 100 µm. CCND1 expression levels by SKOV‐3 MCTS were assessed by qRT‐PCR in the absence or presence of drugs alone or in combination (5 µM PTX, Pect‐MCP 0.025%) GAPDH expression levels were used as internal control and the results were analyzed by REST software (Mean ± SD, n = 3). D, Normal primary ovarian surface epithelial (OSE) cells were isolated and cultured (n = 2) as described in material and methods and Gal‐3 expression levels were significantly lower in OSE cells compared to SKOV‐3 cells as assessed by qRT‐PCR. E, OSE cells were treated with PTX with various concentrations as indicated or with Pect‐MCP (0.025%) alone or in combination for 48h and cytotoxicity was assessed by MTT assay from two independent experiments. *: P ≤ 0.01; **: P ≤ 0.01; ***: P ≤ 0.001 compared to control. Scale bar = 100 µm
