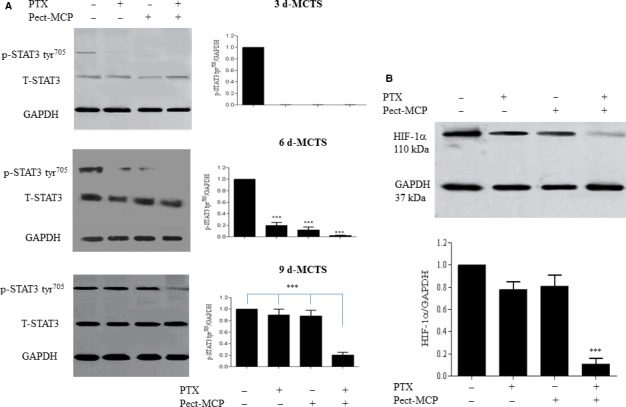
Figure 4.

PTX and Pect‐MCP in combination strongly decrease STAT3 activity and HIF‐1α expression levels in SKOV‐3 MCTS. A, p‐STAT3 tyr705 levels were increased in MCTS in a time‐dependent manner which was abrogated or decreased in 6 and 9 days MCTS, respectively. B, HIF‐1α expression analysis in 9 days MCTS treated with each drug alone or in combination. Western blots represent one of the three independent experiments and results were normalized compared to GAPDH as an internal control. Mean ± SD, n = 3. *: P ≤ 0.01; **: P ≤ 0.01; ***: P ≤ 0.001 compared to control
