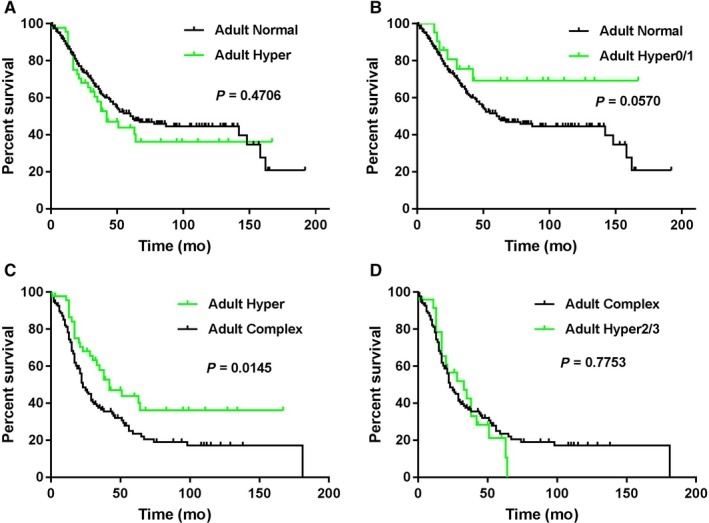
Figure 4.

Comparison of overall survival in adults with B‐ALL and hyperdiploidy, normal and complex karyotype. (A) Hyperdiploidy vs normal karyotype (n = 199); (B) hyper0/1 vs normal karyotype; (C) hyperdiploidy vs complex karyotype (n = 135); (D) hyper2/3 vs complex karyotype
