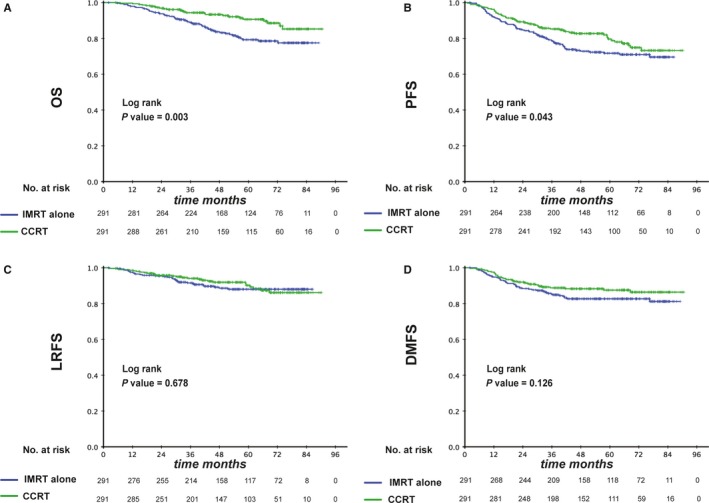
Figure 4.

Kaplan‐Meier survival curves between IMRT and CCRT groups in high‐risk patients (pre‐EBV DNA >1460 copies/mL). Shown are the results for overall survival (A), progression free survival (B), locoregional relapse free survival (C), and distant metastasis free survival (D). P values were calculated using the unadjusted log‐rank test. EBV, Epstein–Barr virus; CCRT, concurrent chemoradiotherapy; IMRT, intensity‐modulated radiotherapy
