Fig. 6.
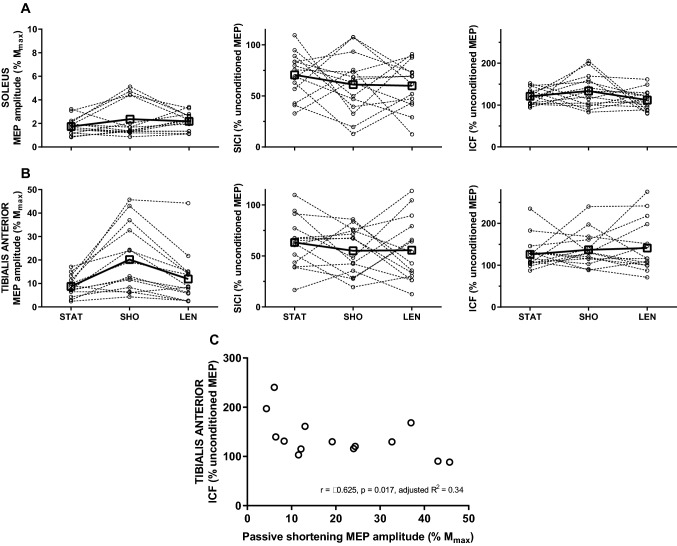
Motor-evoked potentials evoked with single- and paired-pulse transcranial magnetic stimulation during static position, passive shortening, and lengthening in soleus and tibialis anterior. a, b Amplitude of motor-evoked potential expressed as a percentage of the amplitude of maximal compound action potential (MEP/Mmax; left panel), short-interval intracortical inhibition (SICI; centre panel), and intracortical facilitation (ICF; right panel) expressed as a percentage of the unconditioned MEP amplitude during static position (STAT), passive shortening (SHO), and passive lengthening (LEN) in soleus (a) and tibialis anterior (b). Open squares and full lines represent the sample mean, whilst open circles and dashed lines denote individual responses (n = 14). *p < 0.005 compared to resting position and passive lengthening. c The amplitude of motor-evoked potential expressed as a percentage of the amplitude of maximal compound action potential (MEP/Mmax) plotted against ratio of conditioned and unconditioned motor-evoked potential amplitude (ICF) in response to paired-pulse transcranial magnetic stimulation with an inter-stimulus interval of 10 ms during passive shortening in TA (n = 14)

