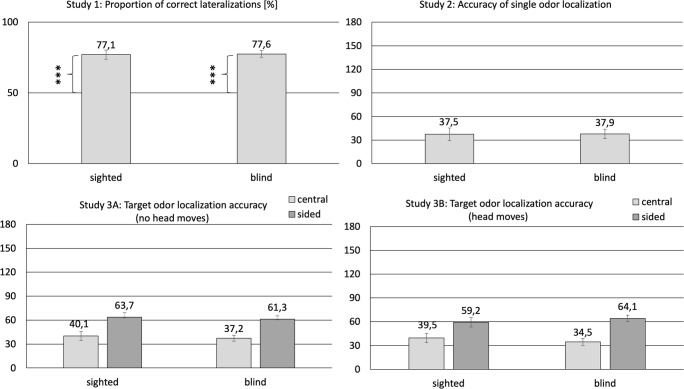
Fig. 1.
Comparison between sighted and blind individuals in terms of their accuracy in lateralization (Study 1) and localization tasks (Studies 2 and 3). In the graph presenting the results of Study 1, axis Y depicts a proportion of correct lateralizations (0–100%), whereas in the graphs illustrating the findings of the Studies 2 and 3, the scale reflects 180°, which is a maximum theoretical difference between the actual and the indicated locations of the odorous substance. Empirically, the values of this difference ranged between 0 and 160°. *** denotes a significant difference (p<.001) between scores obtained by the sighted and the blind individuals as compared to the expected level of chance (50%)

