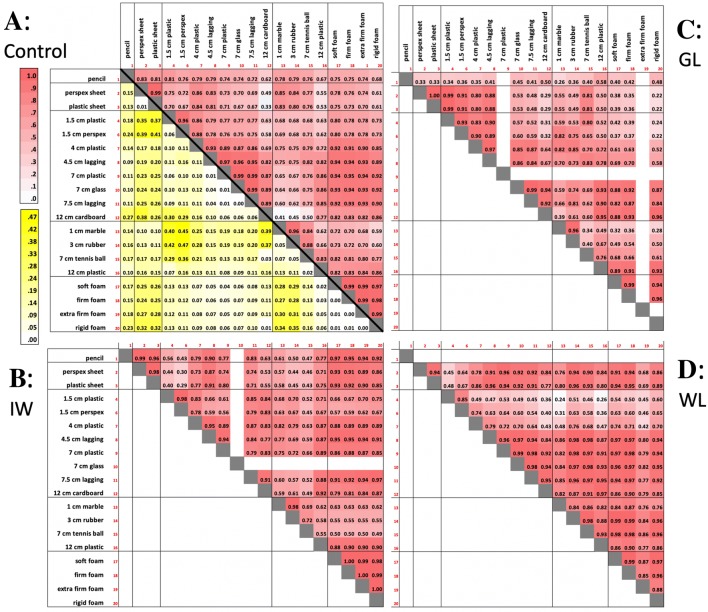
Fig. 9.
Assessment of the correlation of hand postures between pairs of objects. In each panel a–d, we display above the black diagonal the correlation between hand postures for all pairs of objects, with posture quantified by the 15-element finger-to-finger distance vector (Fig. 5). For the controls (panel a), each of these cells indicate the group average of the individual correlations (n = 6). Below the diagonal of panel a, we show the standard deviation of these correlations across the group. Hence, highly correlated postures are in darker red, above the diagonal, and those with maximum variability across the control group are in bright yellow. The remaining panels (b–d) are individual data from the three deafferented participants, IW, GL and WL, respectively. Blocks with less than three good trials were excluded, leading to missing correlations

