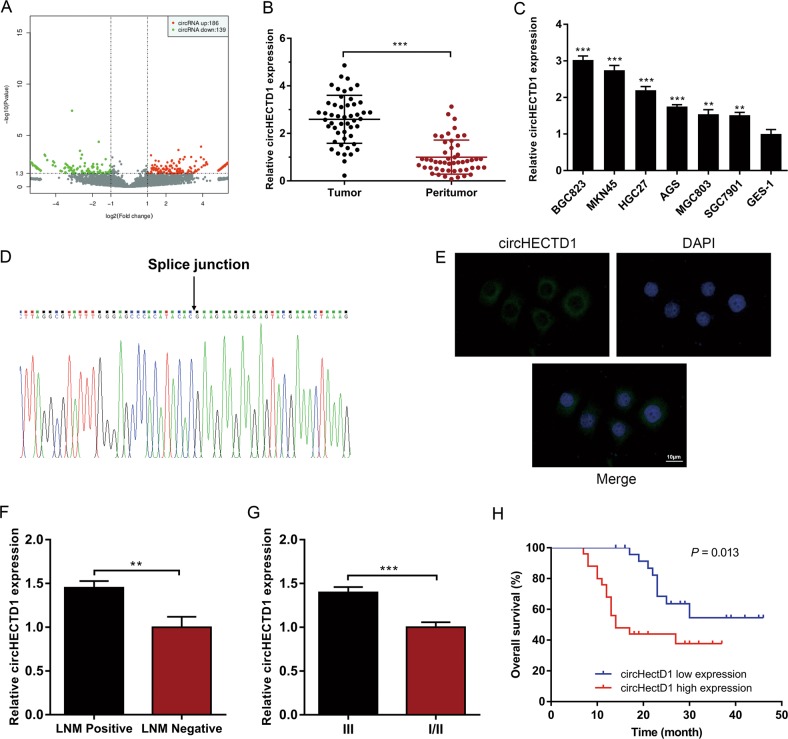
Fig. 1. circHECTD1 is upregulated in gastric cancer (GC) and correlates with unfavorable prognosis.
a Scatter plot showing differentially expressed circRNAs in GC tissues and paired peritumor samples. b circHECTD1 expression was examined in 50 pairs of GC tissues and peritumor samples using qRT-PCR. The expression level of circHECTD1 was significantly higher in GC tissues than in peritumor specimens. The data are shown as the mean ± SEM, n = 50. ***P < 0.001 vs. peritumor tissues. c circHECTD1 expression was investigated in GC cell lines (BGC823, MKN45, HGC27, AGS, MGC803, and SGC7901) and the normal human gastric mucosal epithelial cell line GES-1. The data are shown as the mean ± SEM, n = 3. **P < 0.01, ***P < 0.001 vs. GES-1. d Sanger sequencing was used to validate the presence of circHECTD1. The arrow indicates the head-to-tail splicing sites of circHECTD1. e Representative fluorescence in situ hybridization (FISH) images showing the dominantly cytoplasmic distribution of circHECTD1. f High circHECTD1 expression levels were observed in patients with lymph node metastasis (LNM). The data are shown as the mean ± SEM, n = 50. **P < 0.01 vs. the LNM negative group. g The expression level of circHECTD1 was higher in the AJCC stage III group than in the AJCC stage I/II group. The data are shown as the mean ± SEM, n = 50. ***P < 0.001 vs. the AJCC stage I/II group. h A Kaplan–Meier curve showed that the overall survival of GC patients with high circHECTD1 levels was worse than that of patients with low circHECTD1 levels. P = 0.013

