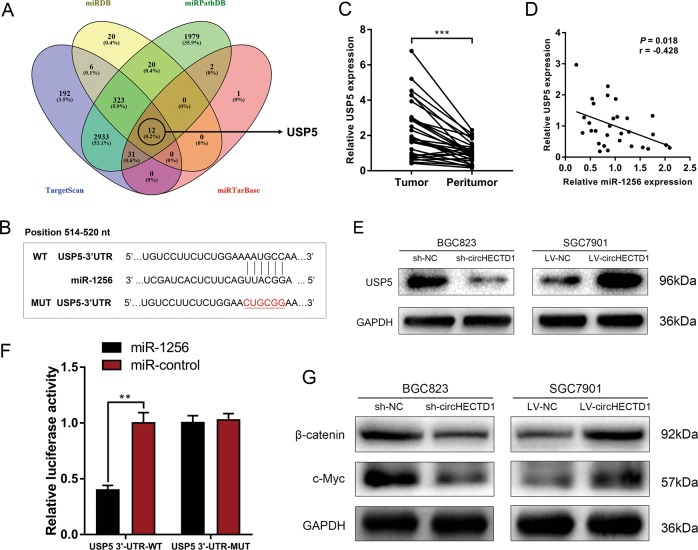
Fig. 6. USP5 is downstream of the circHECTD1/miR-1256 axis.
a Bioinformatics tools (TargetScan, miRDB, miRPathDB, and miRTarBase) were used to predict the downstream targets of miR-1256. USP5 was predicted by all four algorithms. b Complementary sequence between USP5 and miR-1256. c The expression levels of USP5 in GC tissues and matched peritumor samples were examined by qRT-PCR. The data are shown as the mean ± SEM, n = 30. ***P < 0.001 vs. peritumor tissues. d A reverse correlation between miR-1256 and USP5 was detected in GC tissues. n = 30, P = 0.018. e Western blotting was used to investigate the levels of USP5 in circHECTD1-silenced BGC823 cells and circHECTD1-overexpressing SGC7901 cells. f A dual-luciferase reporter assay was conducted to confirm that USP5 was a downstream target of miR-1256. The data are shown as the mean ± SEM, n = 3. **P < 0.01 vs. relative luciferase activity in the USP5 3′-UTR WT with miR-control group. g The expression levels of β-catenin and c-Myc were examined by Western blotting in GC cells with circHECTD1 knockdown or overexpression

