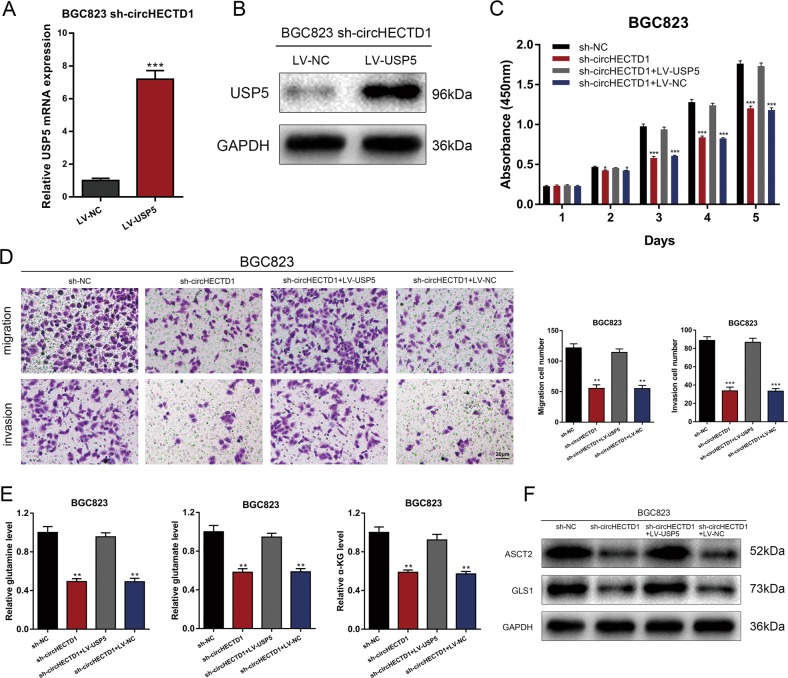
Fig. 7. The circHECTD1/miR-1256 axis affected GC progression through USP5.
a The efficiency of USP5 overexpression was verified by qRT-PCR. The data are shown as the mean ± SEM, n = 3. ***P < 0.001 vs. LV-NC. b The efficiency of USP5 overexpression was verified by Western blotting. c CCK-8 assays were performed to evaluate the effects of USP5 overexpression on the proliferative ability of BGC823 sh-circHECTD1 cells. The data are shown as the mean ± SEM, n = 3. *P < 0.05, ***P < 0.001 vs. sh-NC. d Transwell assays were used to analyze the effects of USP5 overexpression on BGC823 sh-circHECTD1 cells. The data are shown as the mean ± SEM, n = 3. **P < 0.01, ***P < 0.001 vs. sh-NC. e The levels of glutamine, glutamate, and α-KG were examined in BGC823 sh-circHECTD1 cells overexpressing USP5. The data are shown as the mean ± SEM, n = 3. **P < 0.01 vs. sh-NC. f Western blotting was performed to detect the expression levels of ASCT2 and GLS1 in circHECTD1-silenced BGC823 cells overexpressing USP5

