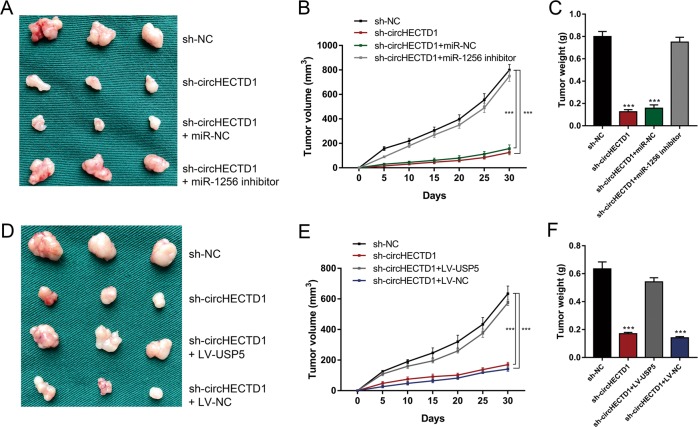
Fig. 9. circHECTD1 facilitated GC progression in vivo by targeting miR-1256, thus upregulating USP5 expression.
a Xenograft tumors in nude mice from the four treatment groups (sh-NC, sh-circHECTD1, sh-circHECTD1 + miR-NC, sh-circHECTD1 + miR-1256 inhibitor) after subcutaneous injection of BGC823 cells (n = 3 for each group). b Xenograft volumes from the four treatment groups (sh-NC, sh-circHECTD1, sh-circHECTD1 + miR-NC, sh-circHECTD1 + miR-1256 inhibitor) were measured at the indicated time points. The data are shown as the mean ± SEM, n = 3. ***P < 0.001 vs. sh-NC. c Xenograft weights were compared between different groups (sh-NC, sh-circHECTD1, sh-circHECTD1 + miR-NC, sh-circHECTD1 + miR-1256 inhibitor). The data are shown as the mean ± SEM, n = 3. ***P < 0.001 vs. sh-NC. d Xenograft tumors in nude mice from the four treatment groups (sh-NC, sh-circHECTD1, sh-circHECTD1 + LV-USP5, sh-circHECTD1 + LV-NC) after subcutaneous injection of BGC823 cells (n = 3 for each group). e Xenograft volumes from the four treatment groups (sh-NC, sh-circHECTD1, sh-circHECTD1 + LV-USP5, sh-circHECTD1 + LV-NC) were measured at the indicated time points. The data are shown as the mean ± SEM, n = 3. ***P < 0.001 vs. sh-NC. f Xenograft weights were compared between different groups (sh-NC, sh-circHECTD1, sh-circHECTD1 + LV-USP5, sh-circHECTD1 + LV-NC). The data are shown as the mean ± SEM, n = 3. ***P < 0.001 vs. sh-NC

