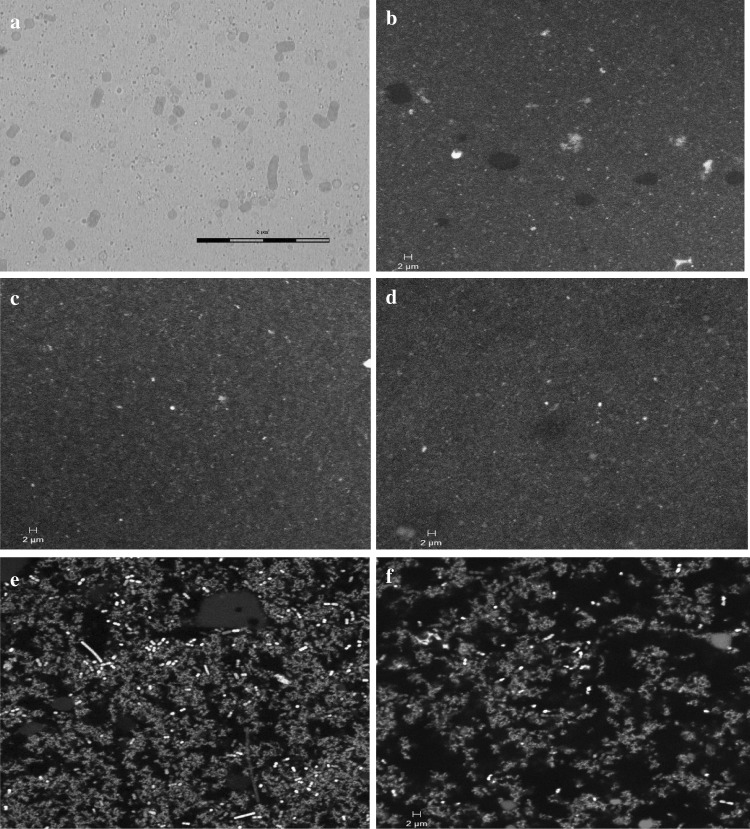
Fig. 2.
a Photomicrograph of homogenized Spirulina-milk slurry showing disrupted cells and fragments of Spirulina platensis, Scale bar = 8 µm. Representative confocal micrographs, b toned milk, c control (toned milk subjected to homogenization), dSpirulina-milk emulsion, e probiotic control yogurt (PCY) and f probiotic Spirulina yogurt with 7% (w/w) fresh Spirulina biomass (PSY). The green region depicts protein matrix and the red region depicts fat globules, Scale bar = 2 µm (color figure online)

