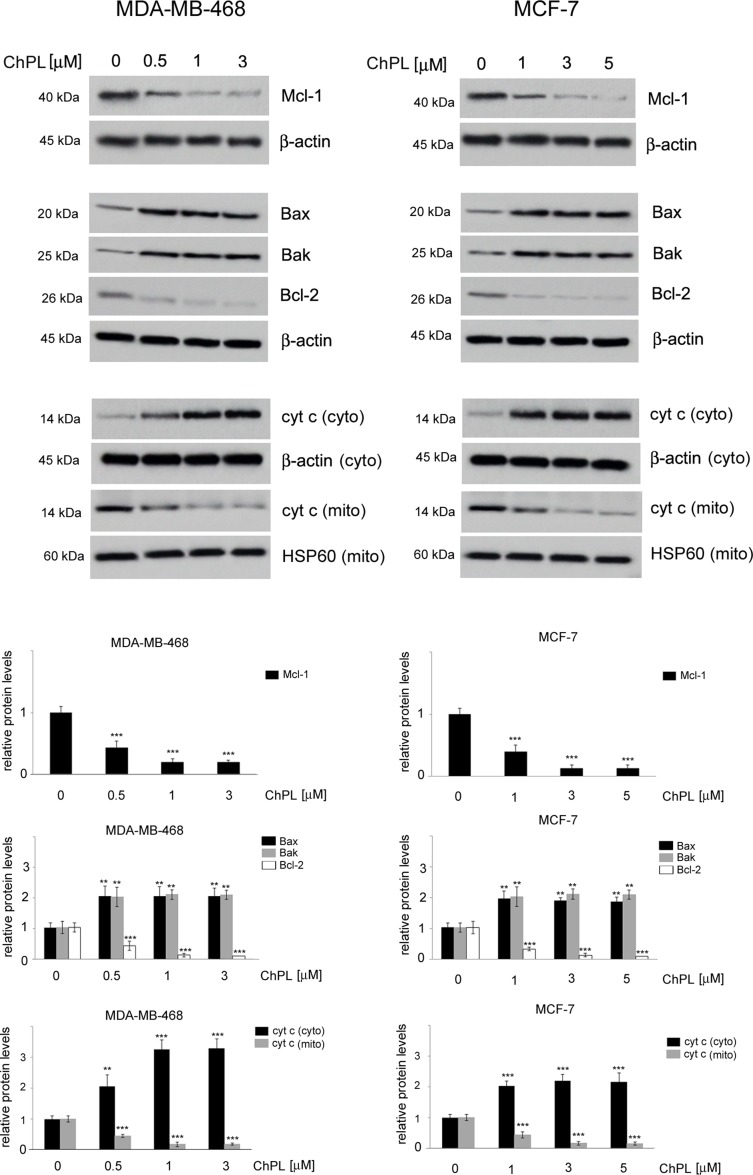
Figure 3.
Effects of 3-chloroplumbagin on the expression levels of Bcl-2 family proteins and cytochrome c in breast cancer cells. MDA-MB-468 and MCF-7 cells were treated with the indicated concentrations of ChPL for 24 h, and the levels of Mcl-1, Bax, Bak, Bcl-2 and cytochrome c were assessed by Western blot analysis. Densitometric analysis represents protein levels normalized to β-actin levels or HSP60 levels. Data were analyzed by one-way ANOVA with Tukey’s post hoc tests [p < 0.01 (**), p < 0.001 (***), n = 3].

