Figure 1.
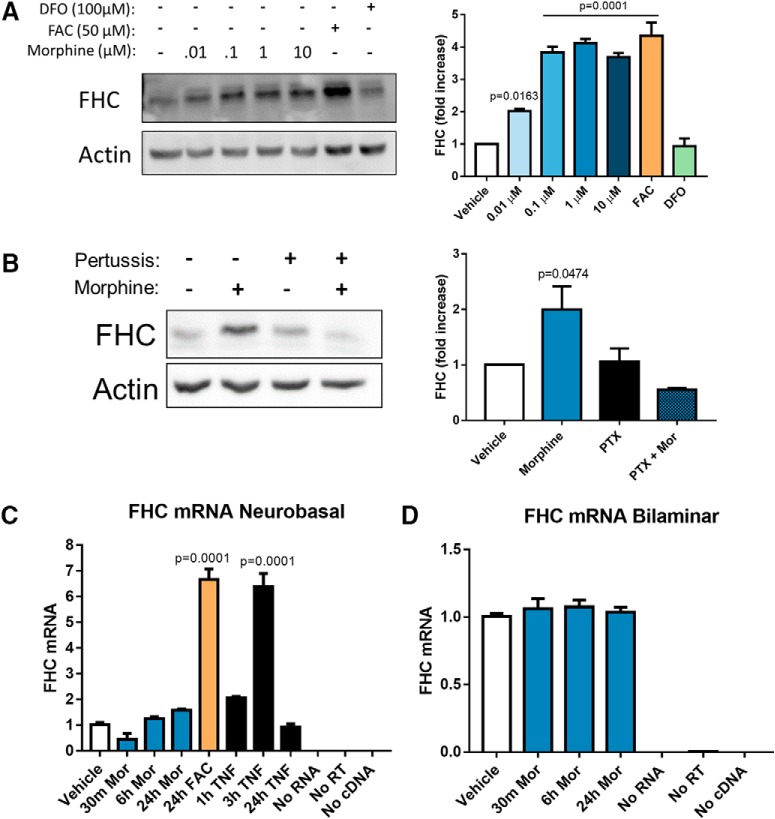
Morphine upregulates FHC protein without altering transcript levels. A, Morphine dose dependently upregulates neuronal FHC. Neurobasal cultures were treated with morphine (0.01, 0.1, 1, or 10 µM) or vehicle for 24 h. Morphine significantly increased FHC protein level at every dose, and 1 µM produced a peak effect. Positive control cultures were iron-loaded with FAC (50 µM, 24 h), and negative control cultures were iron-chelated with DFO (100 µM, 24 h). Iron loading significantly increased FHC protein levels, while iron chelation did not alter FHC protein levels, showing that neurobasal cultures could predictably respond to altered iron levels through FHC synthesis; F(6,14) = 52.697, p < 0.0001. B, Blocking Gαi signaling inhibits morphine-mediated FHC upregulation in bilaminar cultures. Cultures were pre-treated with PTX (200 ng/ml) or vehicle for 2 h, followed by addition of morphine (1 µM, 24 h). Morphine alone significantly increased FHC protein levels, but pre-treatment with PTX completely blocked FHC upregulation by morphine; F(3,8) = 6.2933, p = 0.0168. C, Morphine does not change FHC transcript expression in neurobasal cultures. Cultures were treated with morphine (1 µM) for 30 min, 6 h, or 24 h before collection of total RNA. Morphine had no effect on FHC transcript expression as assessed by qPCR. Positive control cultures either iron loaded with a high concentration of FAC (100 µM) for 24 h or treated with TNFα (10 ng/ml) for 3 h significantly upregulated FHC transcripts, showing that the cultures were capable of increasing FHC gene expression; F(7,16) = 94.711, p < 0.0001. D, Morphine does not change FHC transcript expression in bilaminar cultures. As before, cultures were treated with morphine (1 µM) for 30 min, 6 h, or 24 h before collection of total RNA. Again, morphine had no effect on neuronal FHC transcript levels, even in the presence of a glial feeder layer; N = 4 experiments, F(3,42) = 0.38357, p = 0.7654. In both C, D, FHC transcripts were quantified using the ΔΔCT method, and data are presented relative to GAPDH. All experiments analyzed by one-way ANOVA and Dunnett post hoc.

