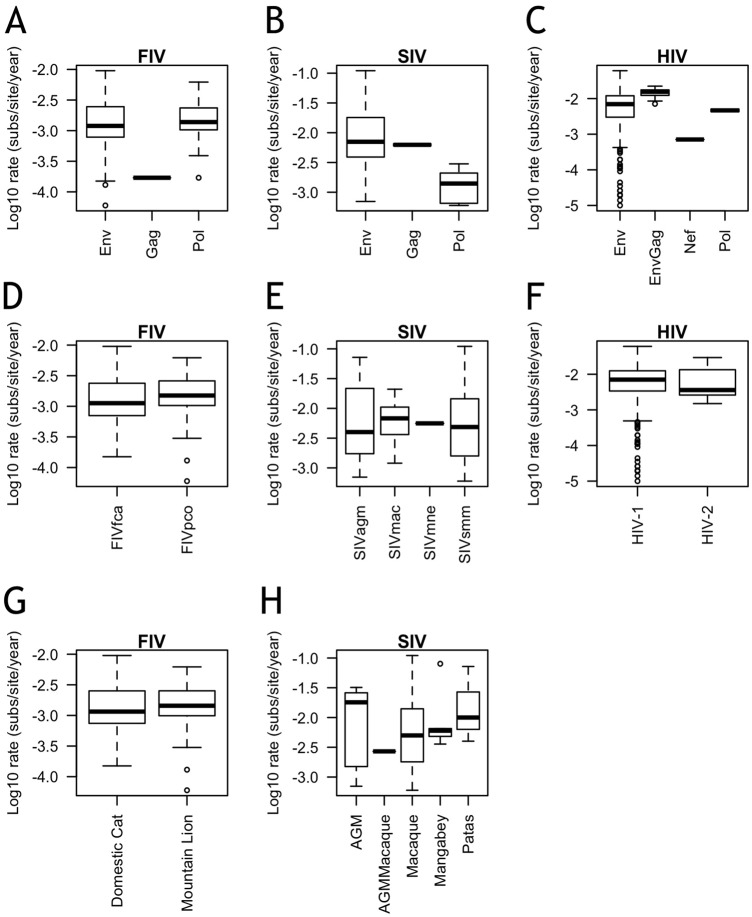
FIG 2.
Few differences are noted in intra-individual evolution rates within a single host. Shown are log10 intra-individual evolution rates by gene (A, B, C), strain (D, E, F), and host species (G, H) for FIV (A, D, G), SIV (B, E, H), and HIV (C, F). Sample sizes for numbers of independent viral infections analyzed: for FIV, env, n = 72, gag, n = 1, and pol, n = 21; for SIV, env, n = 54, gag, n = 2, and pol, n = 15; and for HIV, env, n = 205, envgag, n = 10, nef, n = 1, and pol, n = 2. Sample sizes for individual infections with each strain: FIVfca, n = 54, FIVpco, n = 42, SIVagm, n = 11, SIVmac, n = 15, SIVmne, n = 1, SIVsmm, n = 44, HIV-1, n = 205, and HIV-2, n = 13. Sample sizes for host species: domestic cats, n = 56, mountain lions, n = 40, African green monkeys (AGM), n = 5, AGMMacaque, n = 1, macaques, n = 57, mangabeys, n = 5, and patas monkeys, n = 3. Boxes represent the interquartile ranges of the data, and bars represent the median values. T bars represent the main bodies of data, and open circles represent outlying data points.

