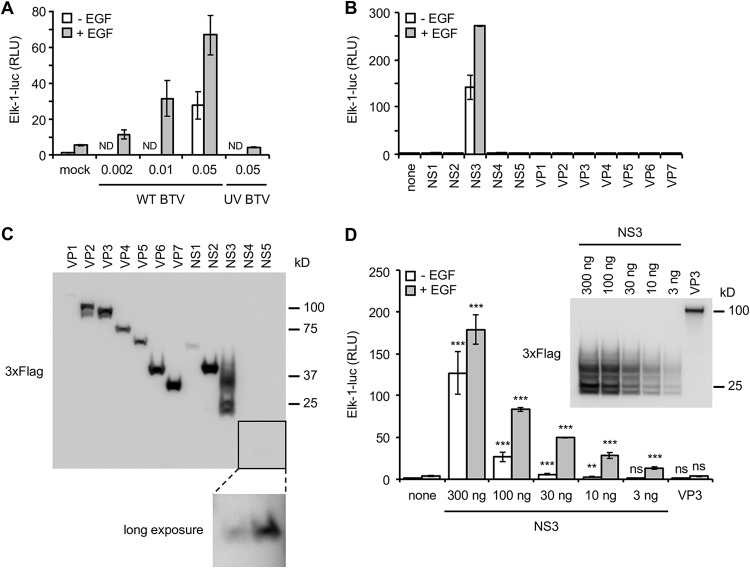
FIG 1.
Activation of the MAPK/ERK pathway by BTV-NS3. (A) HEK-293T cells were transfected with pFA2-Elk1 to express Elk1 transcription factor fused to the DNA binding domain of Gal4, pGal4-UAS-Luc, which contains the firefly luciferase reporter gene downstream of a promoter sequence containing Gal4 binding site, and pRL-CMV, which drives Renilla luciferase expression constitutively. At 12 h after transfection, the cells were serum starved, and 6 h later EGF was added at a final concentration of 400 ng/ml. At the time of EGF stimulation, the cells were also infected with WT BTV at the indicated MOIs or UV inactivated BTV (MOI = 0.05). After 24 h, the relative luciferase activity was determined. ND, not determined. (B) Same experiments as in panel A but, in addition to these three plasmids, the cells were cotransfected with 300 ng of expression vectors encoding BTV ORFs in fusion with the 3×FLAG tag. At 12 h after transfection, the cells were serum starved, and 6 h later EGF was added at a final concentration of 400 ng/ml. After 24 h, the relative luciferase activity was determined. All experiments were achieved in triplicate, and the data represent means ± the SD. (C) HEK-293T cells were transfected with 300 ng of expression vectors encoding BTV ORFs in fusion with the 3×FLAG tag. At 12 h after transfection, the cells were serum starved for 24 h. The cells were then lysed, and the expression levels of 3×FLAG-tagged BTV proteins were detected by anti-3×FLAG immunoblotting. (D) As described in panels A and B, HEK-293T cells were cotransfected with pFA2-Elk1, pGal4-UAS-Luc, pRL-CMV, and different amounts (300, 100, 30, 10, and 3 ng) of an expression vector encoding 3×FLAG-tagged BTV-NS3, BTV-VP3 (300 ng), or the corresponding empty vector pCI-neo-3×FLAG (300 ng). At 12 h after transfection, the cells were serum starved, and 6 h later EGF was added at a final concentration of 400 ng/ml. After 24 h, the relative luciferase activity was determined. All experiments were achieved in triplicate, and data represent means ± the SD. *, P < 0.05; **, P < 0.005; ***, P < 0.0005 (differences observed with the corresponding control vector pCI-neo-3×FLAG). ns, nonsignificant differences. In parallel, the indicated 3×FLAG-tagged BTV proteins were detected by anti-3×FLAG immunoblotting. Sizes are shown in kilodaltons (kDa).

