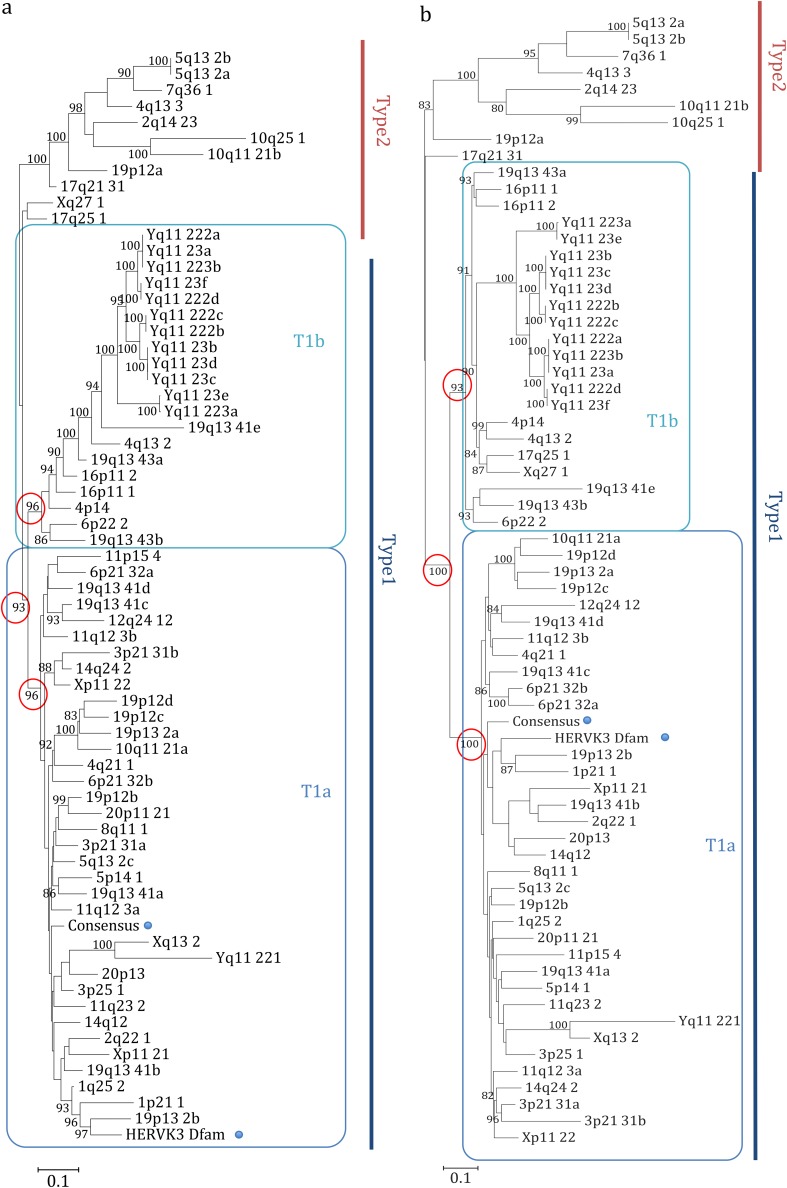
FIG 2.
Phylogenetic analysis of the internal sequences. The phylogeny was investigated by using the NJ method and the Kimura two-parameter model (a) and by performing an ML analysis and a K80 model test (b) of a consensus alignment of internal sequences. The two intragroup clusters (types 1 and 2) are indicated by blue and red lines, respectively, whereas the additional distribution of type 1 elements in two subtypes (1a and 1b) is indicated by squares.

