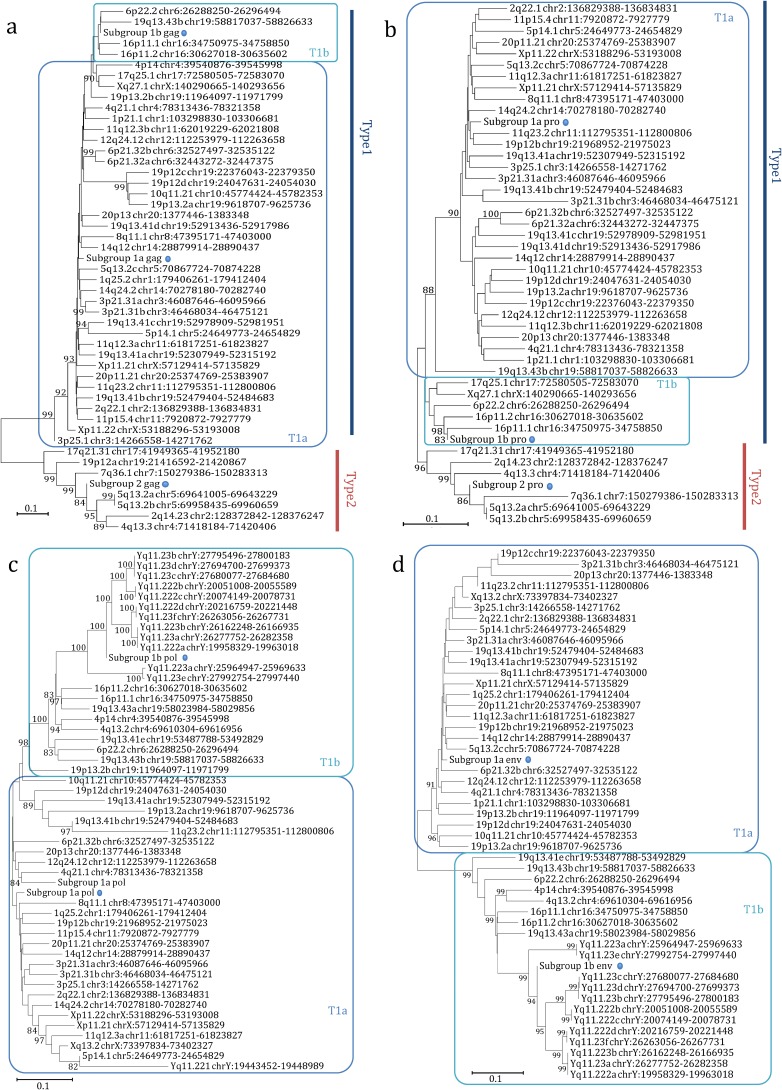
FIG 5.
Phylogenetic analysis of the HML-6 nucleotide sequences of gag (a), pro (b), pol (c), and env (d) genes. Blue and red lines indicate genes of type 1 and 2 proviruses, while type 1a and 1b clusters are indicated by squares. The three intragroup consensus sequences of the genes are also included in the analysis and indicated by a dot. The evolutionary relationship has been ascertained by using the NJ method and the Kimura two-parameter model; the phylogenetic tree was built by using the bootstrap method with 1,000 replicates.

