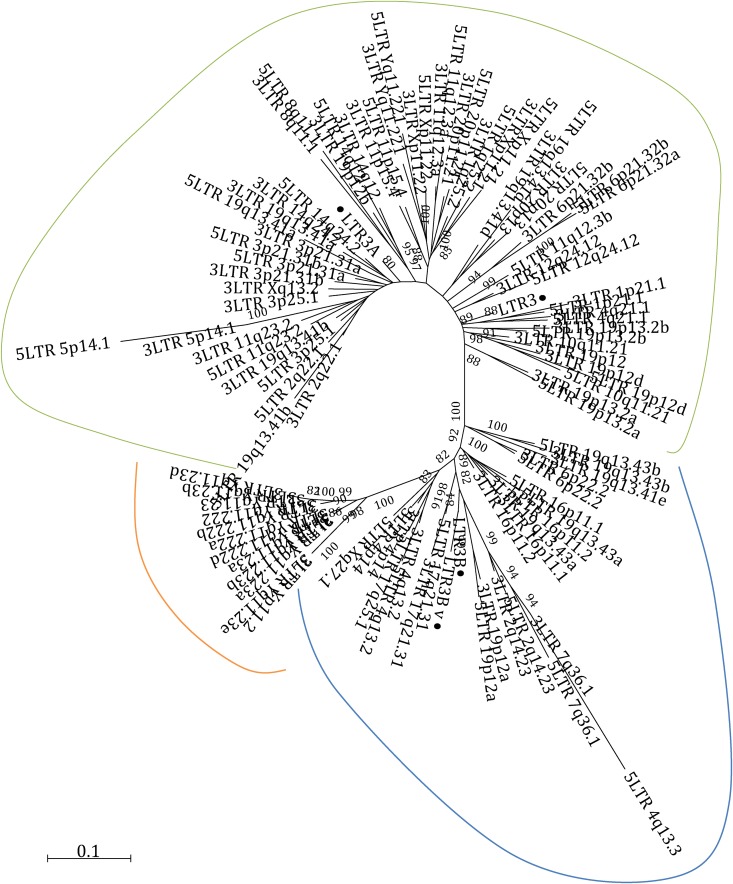
FIG 7.
Phylogenetic characterization of HML-6 LTRs. The evolutionary distance between the LTRs is shown in a phylogenetic tree that includes all HML-6 LTRs and the LTR Dfam consensus sequences (black dots). The tree shows three different clusters of sequences showing LTR3A and LTR3 (green line), LTR3B (light blue line), and LTR3B_v (orange line) elements.

