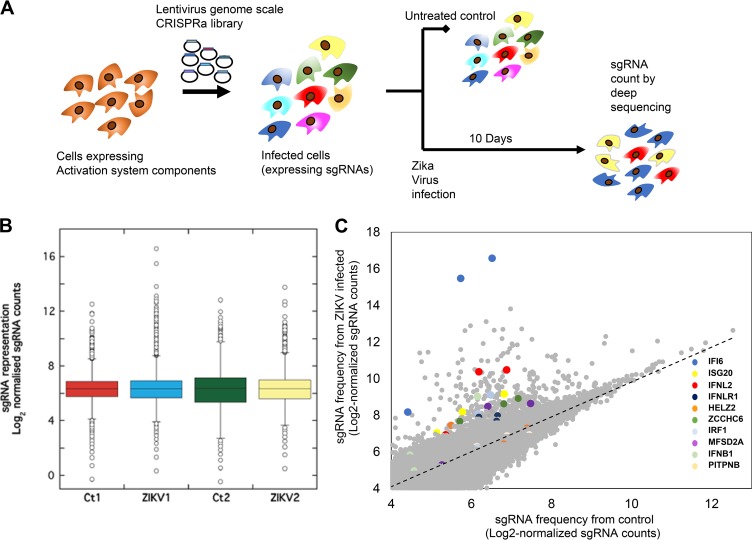
FIG 1.
ZIKV CRISPR activation screen. (A) A scheme summarizing the screen conditions. (B) Box plots showing the distribution of sgRNA frequencies after control or ZIKV infection from n = 2 infection replicates. Multiple guides are seen to be enriched following infection, revealing guides that promote resistance to ZIKV. Boxes, 25th to 75th percentiles; whiskers, 1st to 99th percentiles. (C) Scatter plot showing enrichment of sgRNAs targeting the top candidate genes identified by RIGER and MAGeCK (colored dots) compared with other sgRNAs in the library (gray dots) after ZIKV infection.

