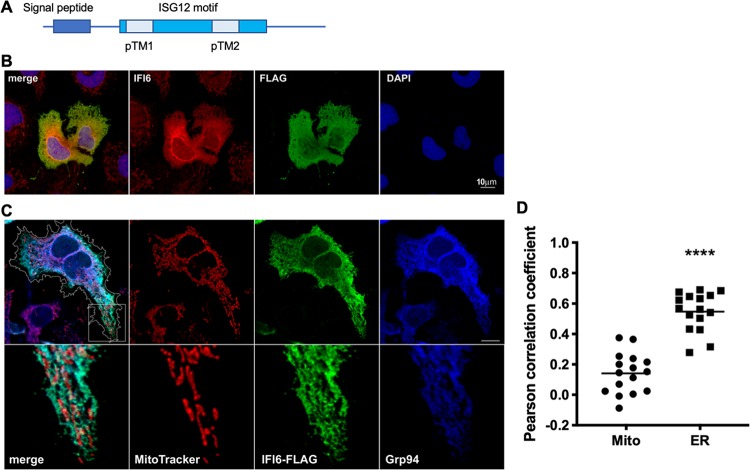
FIG 3.
Immunofluorescence microscopy of cells expressing IFI6-FLAG. (A) A schematic representation of IFI6 structural domain organization. (B) Huh7 cells were transfected with IFI6-FLAG. After 24 h, the cells were stained with IFI6-specific and FLAG-specific antibodies. Scale bar = 10 μm. (C) Huh7 cells were transfected with IFI6-FLAG and after 24 h, the cells were stained with MitoTracker, fixed, and costained with anti-FLAG and anti-GRP94 antibodies. Bottom panel is 3.5-fold enlargement of the area labeled with a white square. The cells were visualized using a confocal microscope. The contour of the IFI6-expressing cell is outlined in white. Scale bar = 10 μm. (D) Graph indicates the Pearson correlation coefficients of IFI6 and MitoTracker or GRP94 localization in 16 cells. ****, P < 0.001, two-tailed, unpaired t test.

