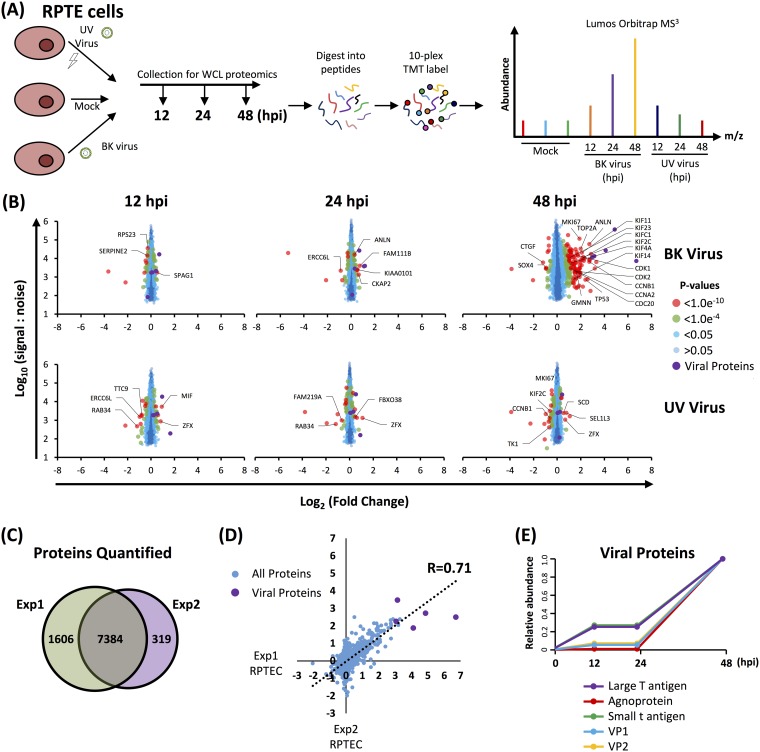
FIG 2.
Repeat quantitative temporal profiling in RPTE cells (experiment 2). (A) Schematic of experimental workflow for experiment 2. (B) Scatter plots of all proteins quantified. Fold change is shown in comparison to the average corresponding value of the mock infection. Benjamini-Hochberg-corrected significance B was used to estimate P values (51). (C) Overlap of proteins quantified between experiment 1 and experiment 2. (D) Scatter plot showing the correlation between experiments 1 and 2 in RPTE cells for proteins quantified by ≥2 peptides. (E) Temporal profiles of the 5 viral proteins quantified, normalized to a maximum of 1.

