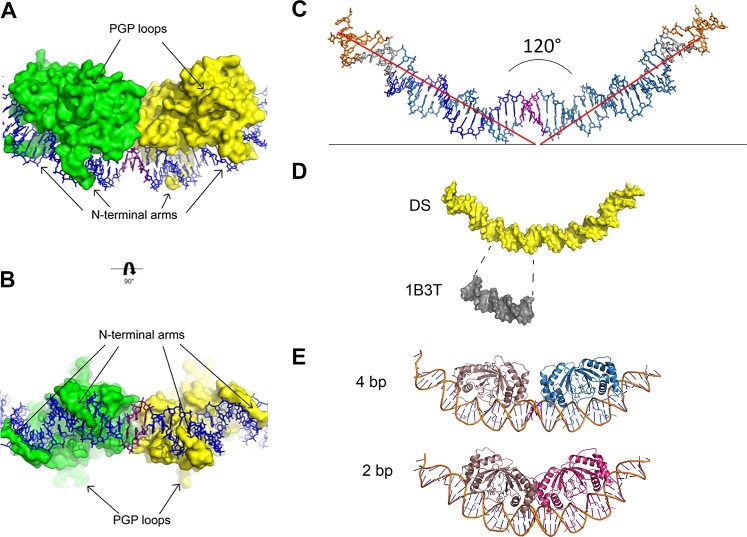
FIG 2.
Protein and DNA analysis. (A and B) The structures of the PGP loops and N-terminal arms are highlighted from 90° rotational views. (C) DNA alone shown in stick representation; coloring is the same as in Fig. 1A. Helical axes from center are represented as red lines. The angle between the axes measures at 120°. (D) The DNA from the complex (yellow) and the structure of Bochkarev et al. (PDB code 1B3T) (gray) shown in surface representation. The DNA for the structure of Bochkarev et al. (PDB code 1B3T) is shown directly under the analogous EBNA1 consensus sequence in the longer DNA. The same degree of unwinding is visually evident in both. (E) (Top) Complex with 4-bp separation modeled on the DNA, with one dimer in taupe and the other in blue. (Bottom) Complex with 2-bp separation modeled on the DNA, one dimer in taupe and the other in red.

