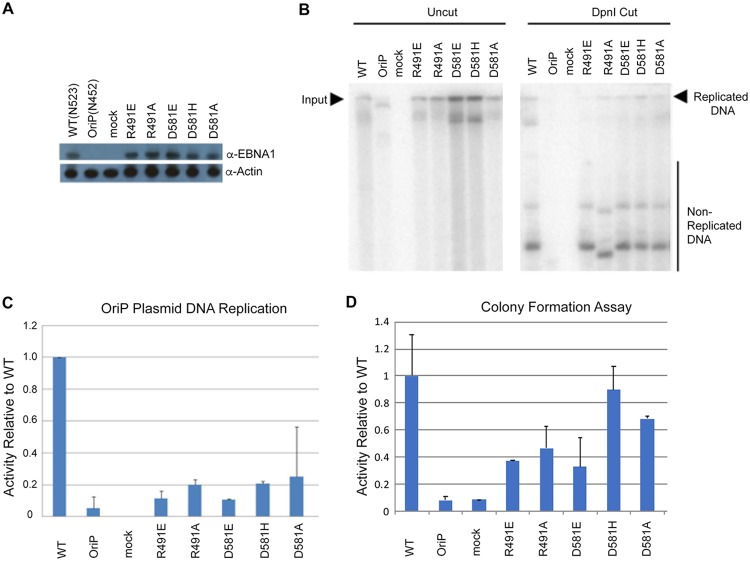
FIG 6.
OriP-dependent DNA replication and colony formation assays. (A) Western blot for transfected 293T cells used for DNA replication assay probed for EBNA1 and the loading control, actin. (B) Representative Southern blot results for all mutants. Input uncut DNA (left panel) and DpnI-resistant replicated DNA (right panel) are indicated. (C) Quantitation of Southern blot results normalized to WT activity. Error bars indicate 1 standard deviation. All mutant activity is statistically significant compared to WT activity (P < 0.05). (D) Colony formation assay for each EBNA1 mutant plasmid in pREP10 using hygromycin resistance and quantified relative to WT EBNA1. Error bars indicate standard deviation and P values of <0.05.

