Fig. 2.

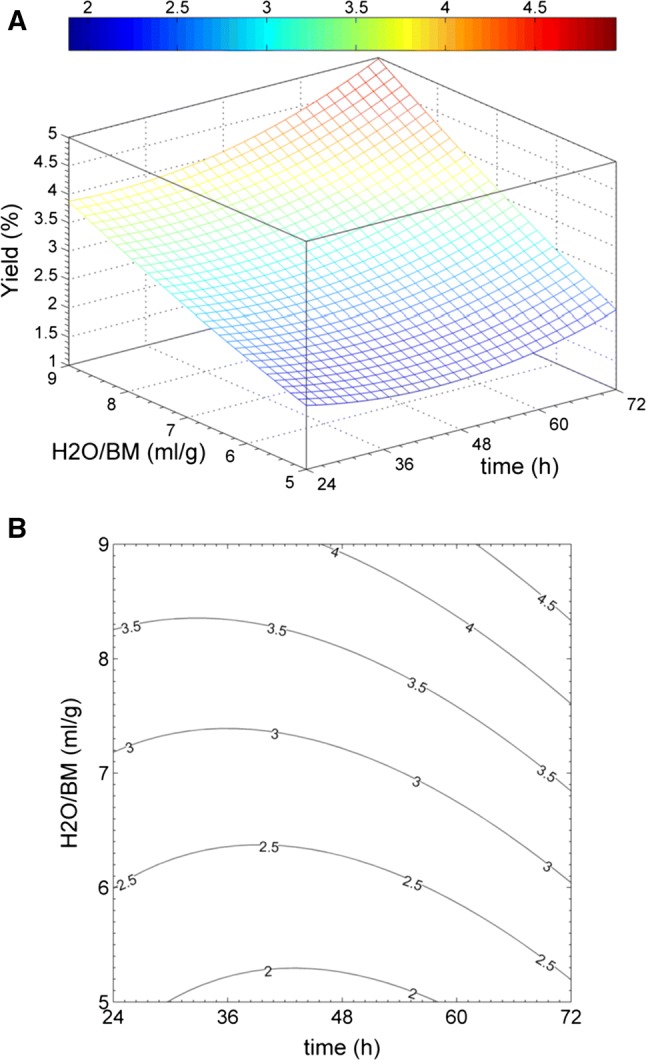
Multiple regression analysis related to the full-factorial experimental design where it is showed the dependence of mucilage yield % on both dilution H2O/BM (g/g) and time t(h): a 3-D plot with yield surface, b contour plot with yield line levels
