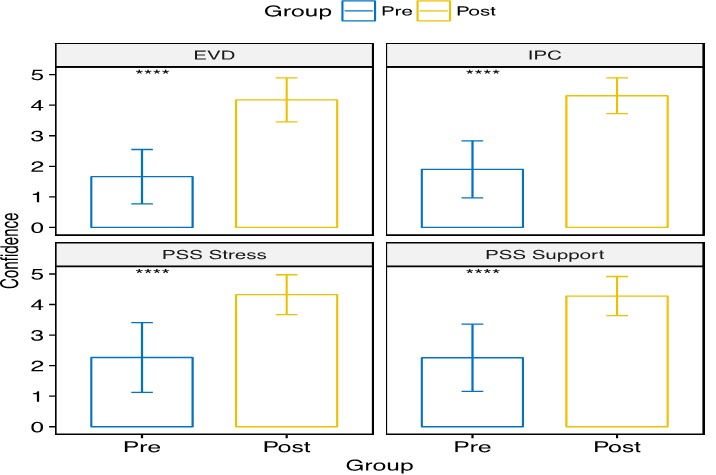
Figure 6.

Pre-and post-test confidence scores for non-clinician subgroup who had the SQS training; bar height represents mean scores at pre- (blue) or post-test (yellow), given a 5-point Likert scale measuring confidence in various areas of the health sector; error bars reflect one standard deviation above and below the mean; mean confidence score in all areas significantly increased between pre- and post-test (++++p < 0.001) clinicians were tested on two additional indicators, relative to non-clinicans
