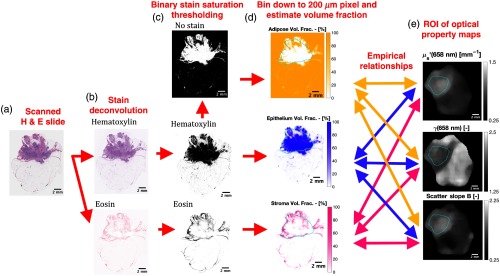
Fig. 1.
(a) A digitally scanned H&E slide with resolution of 500 pixels/mm. (b) Intensity images of the hematoxylin and eosin stains calculated through a color deconvolution of the H&E slide. (c) Binary hematoxylin, eosin, and no stain images calculated from a manual threshold of the color saturation of the deconvolded stain intensity images (note: black = foreground, white = background). (d) Volume fractions estimates of epithelium, stroma, and adipose calculated over areas of the binary stain images. (e) Corresponding optical property maps of the fresh specimen acquired prefixation and prestaining. The lesion outlined in cyan in both (d) and (e) denotes the region over which empirical relationships are determined between the histological and optical data.

