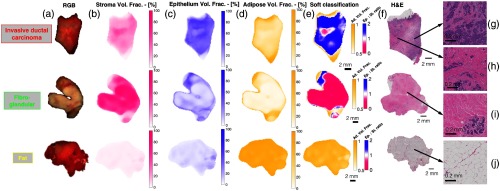
Fig. 4.
(a) Color photographs of representative invasive cancer, fibroglandular, and fat specimens. (b)–(d) Stroma, epithelium, and adipose volume fractions predicted from the optical property maps are shown, respectively, (e) with corresponding classification maps shown. (f) Whole specimen digitized H&E sections are shown, (g)–(j) while representative regions within each specimen are shown, which confirm the prediction of malignant, benign, and fat, respectively.

