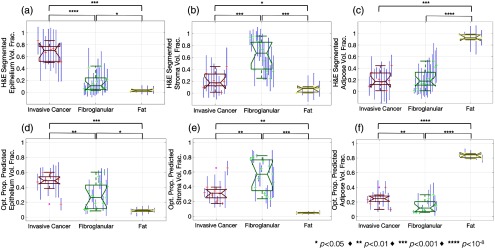
Fig. 6.
(a)–(c) Boxplots of H&E segmented epithelium, stroma, and adipose volume fractions are shown, respectively, (d)–(f) while corresponding boxplots of optical property predicted epithelium, stroma, and adipose volume fractions are shown, respectively. Data points represent means of each specimen, while the H&E segmented error bars represent one standard deviation within each specimen and the optical property predicted error bars represent the standard deviation of the predicted values from each optical property. For each pair of classes, a -value range is shown calculated from two-sample student’s t-tests.

