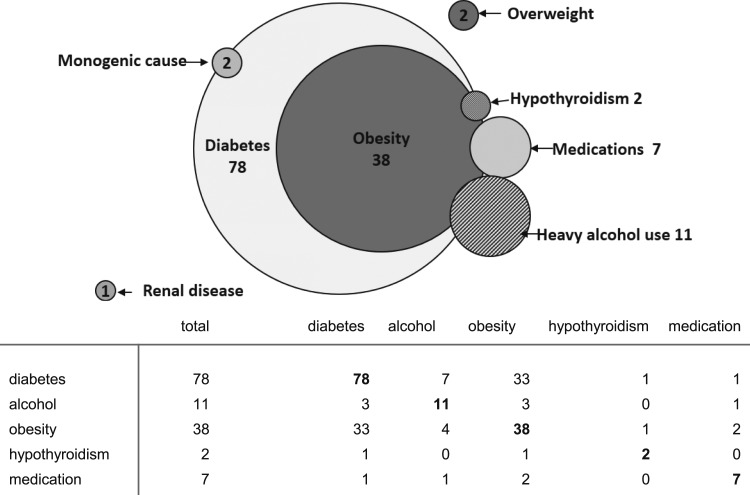
Figure 2.
Schematic representation (Venn diagram) of associated conditions for serum triglyceride levels ≥2000 mg/dL (very severe hypertriglyceridemia). Shared conditions are represented by the areas of overlap among the circles (see tabular data for n in each category). Numbers represent totals for each category. Note: Genetic screening was not done in all patients.

