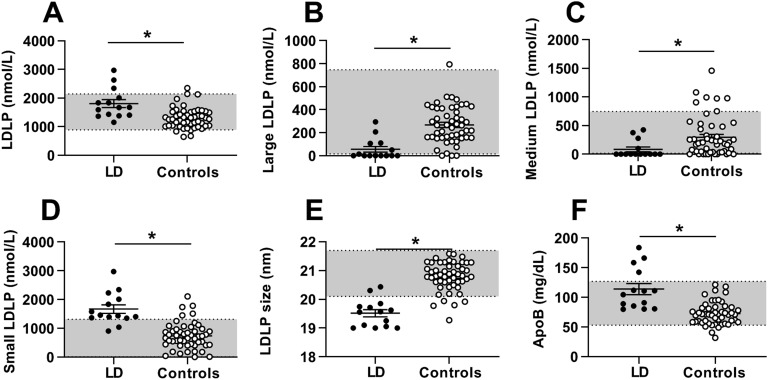
Figure 2.
LDLP parameters in patients with lipodystrophy before metreleptin treatment (black circles) vs healthy controls (open circles). Bars indicate the mean and SEM. (A) Total LDLPs, (B) large LDLPs, (C) medium LDLPs, (D) small LDLPs, (E) LDLP size, and (F) apoB. *P < 0.05 for comparison of controls vs patients with lipodystrophy. Gray shading indicates manufacturer-provided normal range [5th to 95th percentile of a sample of the population (n = 698) of healthy men (n = 284) and women (n = 414) aged 18 to 94 (mean 39 y)].

