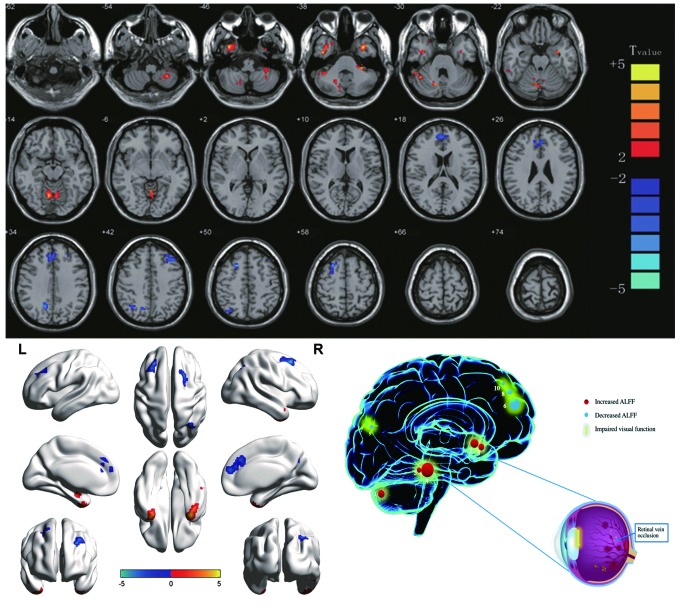
Figure 2.
Significant differences in spontaneous brain activity between the retinal vein occlusion group and healthy controls. The sizes of the spots denote the degree of quantitative changes. The different brain regions were observed in the left cerebellar posterior lobe, right inferior temporal gyrus, left inferior temporal gyrus, bilateral cerebellar anterior lobe, right cerebellar posterior/anterior lobe, bilateral medial frontal gyrus, right precuneus, left middle frontal gyrus, right angular gyrus and right superior frontal gyrus. The red areas denote that patients with RVO exhibit higher ALFF in brain areas than HCs and the blue areas denote brain regions with a lower ALFF [P<0.001 for multiple comparisons using Gaussian random field theory (z.2.3, P<0.001, cluster >13 voxels, Alphasim corrected)]. ALFF, amplitude of low-frequency fluctuation; L, left; R, right. RVO, retinal vein occlusion; HCs, healthy controls; 1, left cerebellar posterior lobe; 2, right inferior temporal gyrus; 3, right cerebellar posterior/anterior lobe; 4, left inferior temporal gyrus; 5, bilateral cerebellar anterior lobe; 6, right angular gyrus; 7, bilateral medial frontal gyrus; 8, right superior frontal gyrus; 9, left middle frontal gyrus; 10, right precuneus.

