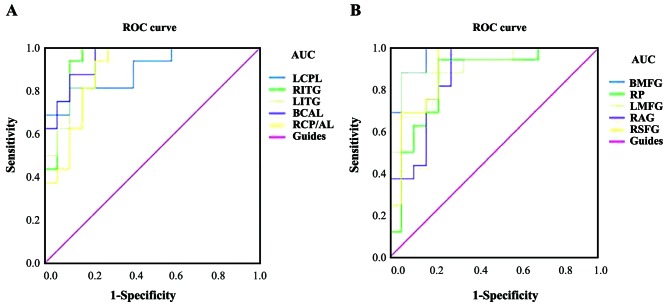
Figure 4.
ROC curve analysis of the mean ALFF values for altered brain regions. (A) The AUCs of different brain regions were as follows: LCPL, 0.897 (P<0.001; 95% CI: 0.790–1.000); RITG, 0.949 (P<0.001; 95% CI: 0.874–1.000); LITG, 0.926 (P<0.001; 95% CI: 0.841–1.000); BCAL, 0.949 (P<0.001; 95% CI: 0.881–1.000); RCP/AL, 0.893 (P<0.001; 95% CI: 0.783–1.000). (B) The AUCs of different brain regions were as follows: BMFG, 0.967 (P<0.001; 95% CI: 0.916–1.000); RP, 0.849 (P=0.001; 95% CI: 0. 711–0.988); LMFG, 0.919 (P<0.001; 95% CI: 0.822–1.000); RAG, 0.868 (P<0.001; 95% CI: 0.742–0.993), RSFG, 0.904 (P<0.001; 95% CI: 0.798–1.000). ALFF, amplitude of low-frequency fluctuation; ROC, receiver operating characteristic; AUC, area under the ROC curve; LCPL, left cerebellar posterior lobe; RITG, right inferior temporal gyrus; LITG, left inferior temporal gyrus; BCAL, bilateral cerebellar anterior lobe; RCP/AL, right cerebellar posterior/anterior lobe; BMFG, bilateral medial frontal gyrus; RP, right precuneus; LMFG, left middle frontal gyrus; RAG, right angular gyrus; RSFG, right superior frontal gyrus.

