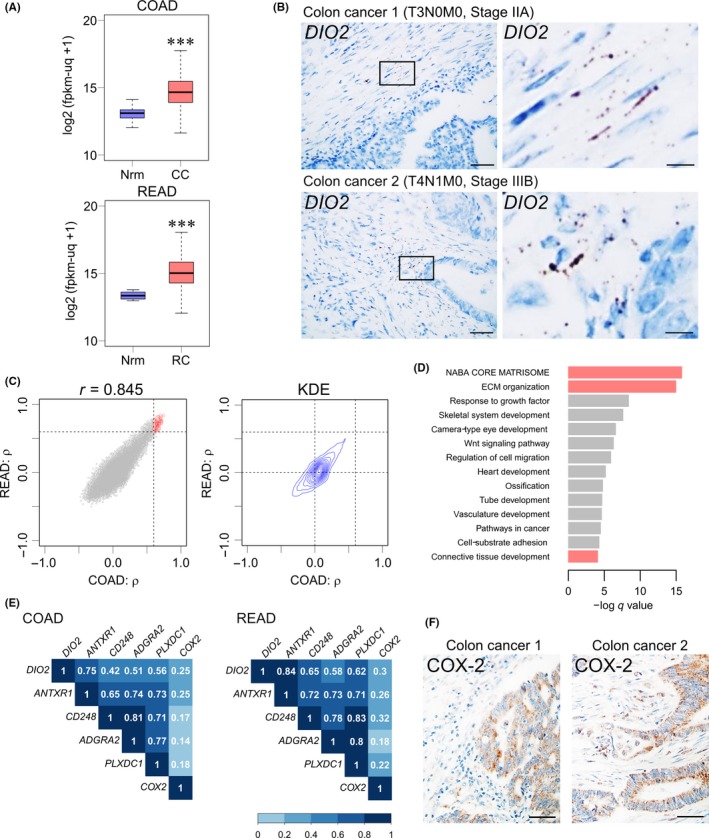
Figure 6.

DIO2 expression is increased in the clinical samples of colorectal cancer. A, RNA sequencing analysis for DIO2 expression in colon and rectal cancer obtained from The Cancer Genome Atlas (TCGA) database (COAD and READ datasets). Unit of Y‐axis: log2(fpkm‐uq + 1). CC, colon cancer tissues; Nrm, normal colon or rectal tissue; RC, rectal cancer tissues. Normal colons, n = 41; colon cancers, n = 469, P = 2.2 × 10⁻¹⁶ by Welch 2‐tailed t test; normal rectums, n = 10; rectal cancers, n = 166, P = 3.35 × 10⁻⁹ by Welch 2‐tailed t test. ***P < .001 compared with the normal colonic or rectal tissue. B, In situ hybridization analysis of DIO2 mRNA in colon cancer clinical samples with hematoxylin counterstaining. Colon Cancer 1, T3N0M0, IIA; Colon Cancer 2, T4N1M0, Stage IIIB. Bars: left panels, 50 μm; right panels, 10 μm. C, Spearman's correlation coefficient (ρ) between expression levels of DIO2 and other genes in TCGA COAD (colon cancer) and TCGA READ (rectal cancer) datasets. X axis, ρ calculated from COAD; Y‐axis, ρ calculated from READ; dashed lines, ρ = 0.6; red circles, selected 195 genes. Two‐dimensional kernel density estimation (KDE); dashed lines, ρ = 0.0 and ρ = 0.6. D, Enrichment analysis of selected 195 genes that were highly coexpressed with DIO2 mRNA in colon and rectal cancer tissues. Red bars, clustering enrichment terms related to ECM. E, Spearman's correlation matrix heat map between DIO2 and tumor endothelial markers (ANTXR1,CD248,ADGRA2, and PLXDC1) and COX‐2 in TCGA COAD and TCGA READ datasets. F, Immunohistochemical analysis of COX‐2 in colon cancer clinical samples with hematoxylin counterstaining. COX‐2 is expressed both in the stromal and epithelial regions. Colon Cancer 1, T3N0M0, IIA; Colon Cancer 2, T4N1M0, Stage IIIB. Bars: 50 μm
