
Figure 6.
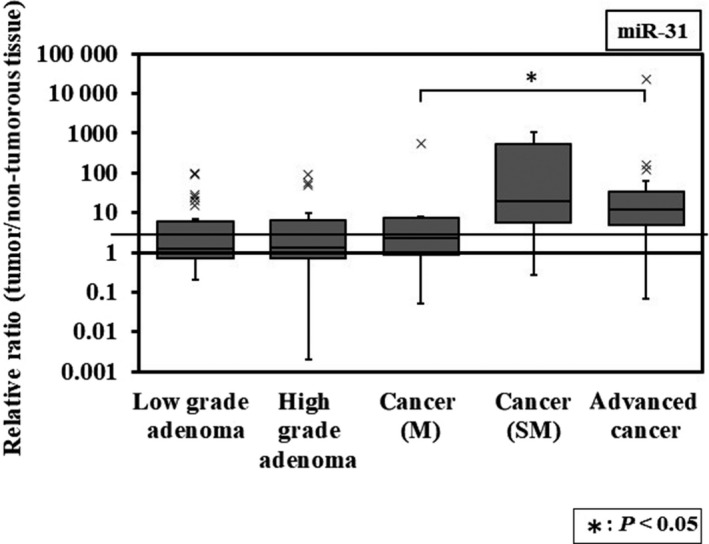
Box‐and‐whisker plots of miRNA‐31 expression in colorectal tumors. The relative expression levels were calculated using the ΔΔCt method, with RNU6B used as a control. The relative expression level in normal tissue was indicated as “1.” M, carcinoma in situ; SM, carcinoma invades submucosa