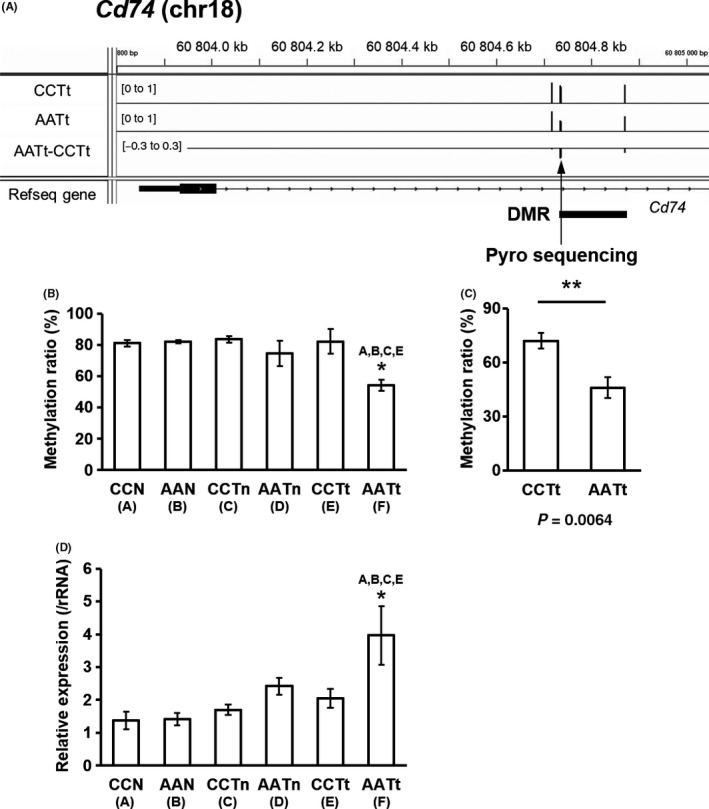
Figure 3.

Validation of the differentially methylated cytosine (DMC) and the gene expression of Cd74 in AATt and CCTt. A, Visualizing reduced‐representation bisulfite sequencing (RRBS) data for DNA methylation levels around TSS region of Cd74 by Integrative Genomics Viewer (IGV). Arrowhead shows the DMC that was assessed by pyrosequencing. B, DNA methylation levels of Cd74 DMR obtained by RRBS analysis. C, Pyrosequencing analysis of the DMC of Cd74. D, mRNA expression of Cd74 measured by real‐time polymerase chain reaction (PCR)
