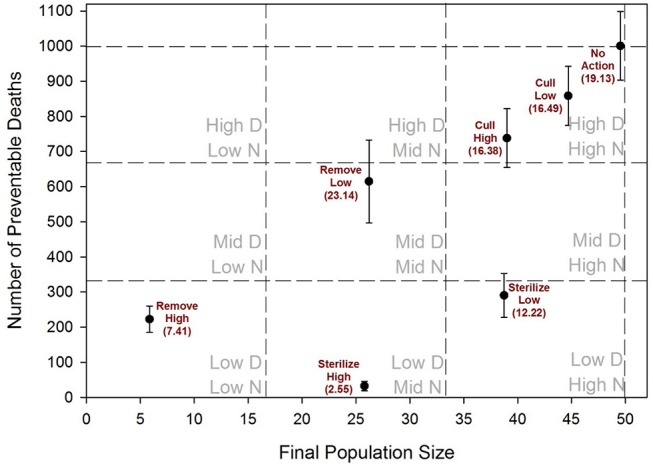
Figure 4.

Comparison of management scenarios across a combination of two outcome types; the number of preventable deaths (as defined in Methods) and final population size at the end of 10 years. The squares defined by the dashed lines represent High, Intermediate (Mid), and Low values for premature deaths (=D) and final population size (=N). Error bars give standard deviations across 100 model iterations, with 95%CI values given in parentheses.
