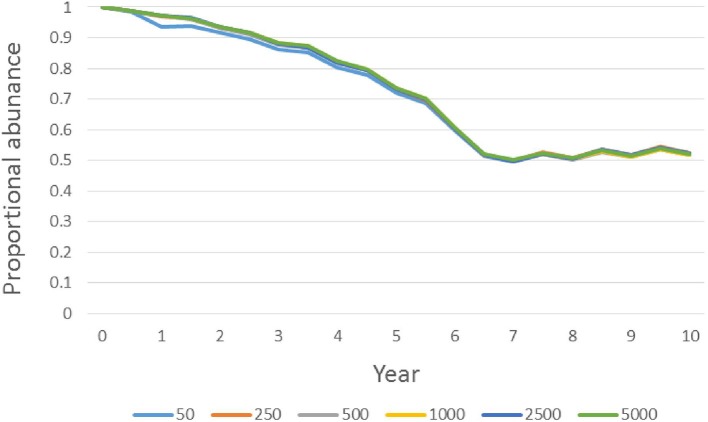
Figure 6.
Proportional population size (scaled to initial size) of focal free-roaming cat populations over time across a range of initial population size values for sterilization management where 75% of intact cats are sterilized during each six-month time step and returned to the population (i.e., Sterilize-High; see text for details). The legend indicates the colors of curves associated with different beginning population sizes. Curves for different initial sizes are almost entirely overlapping, so not all are visible.

