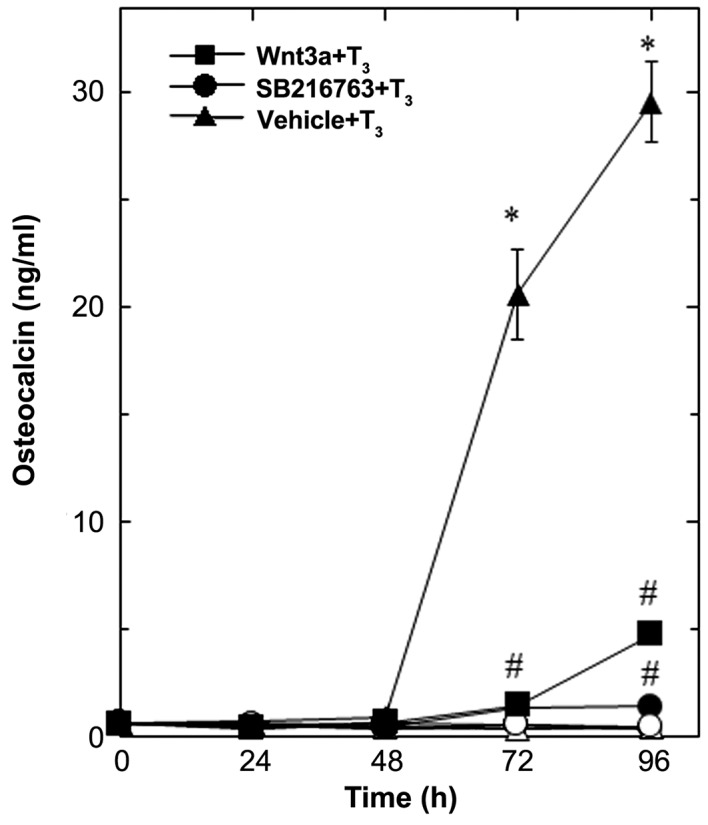
Figure 1.

Effects of Wnt3a on the T3-stimulated osteocalcin release in MC3T3-E1 cells. The cultured cells were pretreated with 30 ng/ml of Wnt3a (■,□), 10 µM of SB216763 (•, ◦) or vehicle (▲,∆) for 60 min, and subsequently stimulated with 10 nM of T3 (■,•,▲) or vehicle (□,◦,∆) for the indicated periods. Osteocalcin concentrations in the culture medium were determined by an ELISA. Each value represents the mean ± SEM of triplicate determinations from three independent cell preparations. Each line binding the closed boxes (■) and the closed circles (•) are the experimental groups indicating Wnt3a or SB216763, respectively, relative to the control line (T3 alone) binding the closed triangles (▲) *P<0.05 vs. the value of the control; #P<0.05 vs. the value of T3 alone. T3, triiodothyronine.
