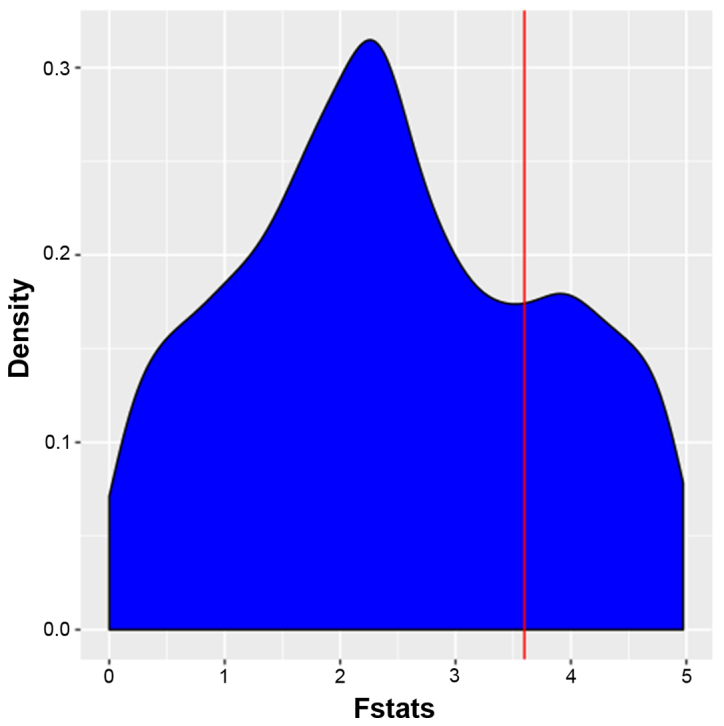
Figure 1.

Distribution of F-values of pathway genes from GSE40182. Time-series gene signature data were analyzed by functional principal component analysis and an F value (x-coordinate, F) was determined for each gene. The Y-axis represents the gene density. Genes were ranked in the order of the F-value and the top 1,000 genes were selected. The red line represents the threshold of the top 1,000 genes.
